Xtreders Xtreders
    #priceaction #kabhi_ta_trading #tradingview #supportresistance #cryptotrading
    Plugin enabled
  • Plugin enabled
  • Plugin enabled

  • Plugin enabled

    Plugin enabled Plugin enabled

  • Arabic
  • Bengali
  • Chinese
  • Croatian
  • Danish
  • Dutch
  • English
  • Event_api_key_regenerated
  • Event_api_limit_reached
  • Event_plugin_disabled
  • Event_plugin_enabled
  • Event_plugin_subscription_expired
  • Event_plugin_subscription_renewed
  • Event_plugin_subscription_started
  • Event_test
  • Filipino
  • French
  • German
  • Hebrew
  • Hindi
  • Indonesian
  • Italian
  • Japanese
  • Korean
  • Persian
  • Portuguese
  • Russian
  • Spanish
  • Swedish
  • Turkish
  • Urdu
  • Vietnamese

Plugin enabled

Plugin enabled Plugin enabled

Plugin enabled

Plugin enabled Plugin enabled

Plugin enabled

Plugin enabled

Plugin enabled

Plugin enabled Plugin enabled

Plugin enabled

Plugin enabled Plugin enabled Plugin enabled Plugin enabled
Plugin enabled
Plugin enabled
Plugin enabled
Plugin enabled
Plugin enabled
Plugin enabled

Plugin enabled Plugin enabled

Posts

Plugin enabled

Plugin enabled

Plugin enabled

Plugin enabled

Plugin enabled

Plugin enabled

Plugin enabled

fxstreetforex
fxstreetforex
1 Plugin enabled ยทPlugin enabled

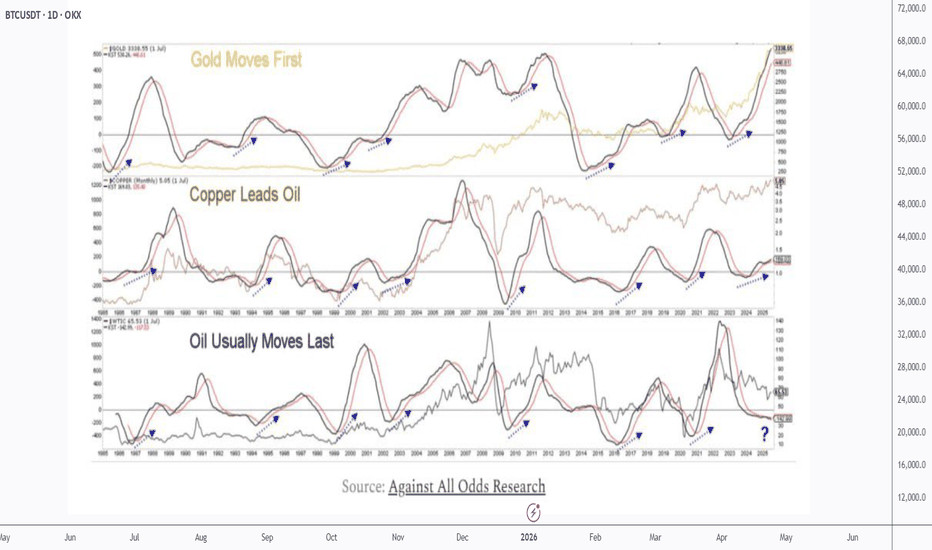
Venezuela: indirect impact on markets could be unexpected theme of 2026Risk is on for the second trading day of the year as equities rise, copper hits a record and Asian tech stocks reach fresh all-time

image
Plugin enabled
Plugin enabled
Plugin enabled
ideas_BTCUSDT
ideas_BTCUSDT
1 Plugin enabled ยทPlugin enabled

BTC/USD Analysis: Bullish Breakout Confirmation($99K Called)
The technical structure for BTC has shifted decisively. The key descending trendline, which previously contained price action, has now been conclusively broken to the upside.
This breakout has been followed by a successful retest of the trendline as new support. Critically, this retest was accompanied by significant buy-side volume, confirming genuine investor conviction and a transfer of ownership at higher levels.
With this bullish confirmation in place, the focus shifts to the major support zone between $88K and $90K. As long as this foundational support holds, the path of least resistance is now higher.
The completed breakout pattern projects a measured move toward an initial upside target of $99K. Price action is now consolidating energy for the next leg upward.
DISCLAIMER: ((trade based on your own decision))
<<press like if you enjoy

image
Plugin enabled
Plugin enabled
Plugin enabled
Ideas_XAUUSD
Ideas_XAUUSD
1 Plugin enabled ยทPlugin enabled

XAUUSD (H4) Monday Setup
Geopolitical shock risk, gold may spike | Trade liquidity and reaction zones only
Quick summary
News around Trumps claim that Maduro has been detained, plus Venezuelas response (they dont know his and his wifes whereabouts and are demanding proof of life), raises geopolitical uncertainty sharply. For gold, thats a classic catalyst for a gap/spike at Monday open.
So my rule for Monday: no FOMO, only trade liquidity zones and confirmed reactions on the chart.
1) Macro context: Why gold can surge on Monday
Rising geopolitical tension often drives flows into safe-haven assets like gold.
When facts are unclear and tensions escalate, the market can open with:
sharp spikes, liquidity sweeps, wider spreads.
Best approach: wait for price to hit levels, then trade the reaction not the headline.
2) Technical view (H4 based on your chart)
Gold is currently moving inside a larger structure after a heavy move, and your chart highlights the key zones clearly:
Key zones
Sell test support 4450 (pullback area where price may get sold)
Liquidity 4330 (major liquidity magnet)
OB 4309 (order block / short-term reaction zone)
Support 4277 (intermediate support)
Buy zone 42034206 (deep support / swing buy area)
3) Monday trading scenarios (Liam style: trade the level)
Scenario A (priority): Spike up SELL around 4450
If gold pumps on the headline at the open:
Sell around 4450 (sell-test zone)
SL: above the most recent swing high (refine on lower TF)
TP1: 4330
TP2: 4309
TP3: 4277
Logic: Headline-driven opens often spike to sweep buy-side liquidity first, then rotate back into value/liquidity.
Scenario B: Sweep down BUY at liquidity zones
If price gets pulled down first:
Buy around 4330 (Liquidity)
Buy confirmat

image
Plugin enabled
Plugin enabled
Plugin enabled
fxstreetforex
fxstreetforex
1 Plugin enabled ยทPlugin enabled

WTI rebounds from two-week lows amid Venezuela turmoil, upside capped below $60West Texas Intermediate (WTI) Crude Oil rebounds sharply on Monday, reversing earlier losses as traders assess the implications of the United States dramatic move against Venezuela following weekend military strikes that led to the ousting of President Nicolas

image
Plugin enabled
Plugin enabled
Plugin enabled
ideas_EURUSD
ideas_EURUSD
1 Plugin enabled ยทPlugin enabled

EUR/USD: A Healthy Correction Ahead of the Next Rally
Hello everyone, Camila here!
On the H4 timeframe, the bullish structure remains clearly intact. Price continues to form higher highs and higher lows, while the ascending trendline drawn from key swing lows is still being respected by the market. This indicates that the primary buying pressure has not left the market.
After breaking out of the compression area and printing a new high, EUR/USD has entered a correction to retest the previous breakout zone. This is a very common technical behavior associated with institutional money flows. The market often returns to recently broken levels to confirm the role shift from resistance to support.
The current correction, in my view, represents a healthy pullback rather than a distribution phase. Selling pressure has not expanded, downside momentum remains controlled, and the bullish structure has not been compromised. In particular, the 1.16501.1660 area stands out as a key support zone, as it aligns with prior structural support and the 50% Fibonacci retracement of the latest bullish impulse.
In the scenario I am monitoring, EUR/USD may continue to decline toward the 1.16501.1660 area to test demand. If price holds this zone and fresh buying signals emerge, the market is likely to rebound toward the 1.17401.1760 resistance zone. A strong break above this resistance would open the door for further upside extension in the medium term.
From a news and macroeconomic perspective, EUR/USD is receiving a degree of support. Expectations that the Fed will maintain a dovish stance throughout 2026 continue to put pressure on U.S. Treasury yields, leading to a relatively weaker U.S. dollar. Recent U.S. economic data point to slowing growth, while inflation is gradually easing, increasing the likelihood of monetary policy ea

image
Plugin enabled
Plugin enabled
Plugin enabled
ideas_BTCUSDT
ideas_BTCUSDT
1 Plugin enabled ยทPlugin enabled

BTCUSDT: Sellers Defend 91,800 as Bullish Momentum Weakens
Hello everyone, here is my breakdown of the current BTCUSDT setup.
Market Analysis
BTCUSDT spent a significant period trading inside a well-defined range, where price oscillated between clear support and resistance levels, showing indecision and balanced participation from both buyers and sellers. Multiple breakout attempts from this range failed, confirming the strength of the boundaries and the lack of sustained momentum during that phase. Eventually, price broke out of the range to the upside and transitioned into a clean ascending channel, signaling a short-term bullish shift. This move was supported by higher highs and higher lows, reflecting increasing buyer control. However, as price approached the major Resistance Zone around 91,800, bullish momentum started to fade. The market printed reactions and hesitation near this resistance, indicating strong selling interest at higher levels.
Currently, the upper boundary of the ascending channel is being tested, and price is currently struggling to hold above the 90,000 Support Zone, which previously acted as a key breakout and demand area. The recent price action suggests that the upside move is losing strength and may be corrective rather than impulsive.
My Scenario & Strategy
My primary scenario: as long as BTCUSDT remains below the 91,800 Resistance Zone and fails to reclaim the upper part of the ascending channel, the bias favors a short-term bearish correction. A rejection from resistance increases the probability of a pullback toward the 90,000 Support Zone, which is the first key downside target. If this support fails to hold, further downside continuation toward lower range levels becomes possible.
However, a strong bullish breakout and acceptance above 91,800 would invalidate the short bias and open th

image
Plugin enabled
Plugin enabled
Plugin enabled
Ideas_XAUUSD
Ideas_XAUUSD
1 Plugin enabled ยทPlugin enabled

GOLD 1H CHART ROUTE MAP UPDATE & TRADING PLAN FOR THE WEEK
Hey Everyone,
Please see our 1h chart levels and targets for the coming week.
We are seeing price play between two weighted levels with a gap above at 4346 and a gap below at 4310, as support. We will need to see ema5 cross and lock on either weighted level to determine the next range.
We will see levels tested side by side until one of the weighted levels break and lock to confirm direction for the next range.
We will keep the above in mind when taking buys from dips. Our updated levels and weighted levels will allow us to track the movement down and then catch bounces up.
We will continue to buy dips using our support levels taking 20 to 40 pips. As stated before each of our level structures give 20 to 40 pip bounces, which is enough for a nice entry and exit. If you back test the levels we shared every week for the past 24 months, you can see how effectively they were used to trade with or against short/mid term swings and trends.
The swing range give bigger bounces then our weighted levels that's the difference between weighted levels and swing ranges.
BULLISH TARGET
4346
EMA5 CROSS AND LOCK ABOVE 4346 WILL OPEN THE FOLLOWING BULLISH TARGETS
4386
EMA5 CROSS AND LOCK ABOVE 4386 WILL OPEN THE FOLLOWING BULLISH TARGETS
4431
EMA5 CROSS AND LOCK ABOVE 4431 WILL OPEN THE FOLLOWING BULLISH TARGETS
4466
BEARISH TARGETS
4310
EMA5 CROSS AND LOCK BELOW 4310 WILL OPEN THE FOLLOWING BEARISH TARGET
4269
EMA5 CROSS AND LOCK BELOW 4269 WILL OPEN THE SWING RANGE
4231
4184
As always, we will keep you all updated with regular updates throughout the week and how we manage the active ideas and setups. Thank you all for your likes, comments and follows, we really appreciate it!
Mr Gold
GoldViewFX

image
Plugin enabled
Plugin enabled
Plugin enabled
fxstreetforex
fxstreetforex
1 Plugin enabled ยทPlugin enabled

Gold Price Forecast: XAU/USD recovers its bullish stance on geopolitical turmoil, tepid US dataSpot Gold trades around the $4,450 level on Monday, sharply up on a daily basis amid broad US Dollar (USD) weakness. The bright metal found support throughout the first half of the day on geopolitical turmoil, extending its advance afterwards on the back of poor United States (US)

image
Plugin enabled
Plugin enabled
Plugin enabled
ideas_EURUSD
ideas_EURUSD
1 Plugin enabled ยทPlugin enabled

EURUSD Institutional Levels: Short Premium 17501800 1600
EURUSD WEEKLY SNAPSHOT EXECUTIVE SUMMARY
EURUSD positioned in a corrective bearish structure (distribution continuation)
Primary sell impulse: 1.1800 1.1600 confirms bearish control
Current price action: corrective rallies (sell-the-rip environment)
Institutional sell zone: 1.1750 1.1800 (major resistance stack)
Intermediate resistance: 1.1750 (reaction zone before continuation)
Bearish bias remains valid below: 1.1800
Downside liquidity targets:
First buy-side liquidity: 1.1600
Expansion support / max pain: 1.1500
Market structure: lower highs + weak retracements = continuation risk
Expect rallies to be capped before range expansion lower
Invalidation: sustained acceptance above 1.1800
Strategy: Short sell rips / rallies into resistance
Larger accumulation likely only after liquidity is swept below 1.16001.1500
________________________________________
EURUSD MARKET LOGIC Institutional Read
Sellers defend premium zones (1.17501.180
Buyers are reactive, not aggressive
Downward arrows dominate flow bearish continuation favored
Any upside without acceptance = distribution
________________________________________
EURUSD WEEKLY SCENARIOS WHATS YOUR PLAY?
Let me know in the comments section below.
Which path do you expect for EURUSD this week?
Rejects 1.17501.1800 clean selloff toward 1.1600
(Textbook sell-the-rip continuation)
Range grind below 1.1750 liquidity build breakdown to 1.1500
(Slow bleed before acceleration)
Fake breakout above 1.1750 sharp rejection impulsive drop
(Bull trap / stop-hunt scenario)
Your level: drop ONE price youre watching m

image
Plugin enabled
Plugin enabled
Plugin enabled
ideas_BTCUSDT
ideas_BTCUSDT
1 Plugin enabled ยทPlugin enabled

Commodity Supercycles Dont Start Where Most People Look
One thing I have learned over the years:
Gold is usually first. (already done)
Not because the economy is booming, but because something feels off. Wars... Inflation... you name it. Gold reacts before the story is clear.
Then silver starts waking up. (happening)
Thats usually when attention shifts from protection to opportunity. Silver doesnt just follow gold, it magnifies it. It is cheaper and more convenient especially for those who missed gold's move!
After that, the industrial metals come into play.
Copper, palladium, platinum. This is where the cycle starts to feel real. Demand is no longer theoretical. Growth shows up on the charts. (this feels just like altcoin season in crypto lol)
Oil and gas tend to move later.
Not last by accident. By then, expansion is obvious and inflation pressures are already building.
Most traders get this backwards.
They chase whats already moving instead of asking why its moving.
The edge isnt guessing the top or bottom.
Its understanding what stage the market is in and positioning accordingly.
Honest question...
Are you reacting to what already moved or paying attention to whats just starting?
Disclaimer: This is not financial advice. Always do your own research and manage risk properly.
Stick to your trading plan regarding entries, risk, and management.
Good luck!
All Strategies Are Good; If Managed Properly!
~Richard Nasr

image
Plugin enabled
Plugin enabled
Plugin enabled
Showing 31 out of 274
  • 27
  • 28
  • 29
  • 30
  • 31
  • 32
  • 33
  • 34
  • 35
  • 36
  • 37
  • 38
  • 39
  • 40
  • 41
  • 42
  • 43
  • 44
  • 45
  • 46

Plugin enabled

Plugin enabled


Plugin enabled
Plugin enabled
Plugin enabled
Plugin enabled /home/xtreders.com/public_html/themes/wondertag/layout/modals/site-alerts.phtml on line 208

Warning: Trying to access array offset on value of type null in /home/xtreders.com/public_html/themes/wondertag/layout/modals/site-alerts.phtml on line 208
https://xtreders.com/setting&user=&page=monetization">Plugin enabled

Plugin enabled

Plugin enabled

Plugin enabled

Plugin enabled