Xtreders Xtreders
    #priceaction #kabhi_ta_trading #tradingview #supportresistance #cryptotrading
    Plugin enabled
  • Plugin enabled
  • Plugin enabled

  • Plugin enabled

    Plugin enabled Plugin enabled

  • Arabic
  • Bengali
  • Chinese
  • Croatian
  • Danish
  • Dutch
  • English
  • Event_api_key_regenerated
  • Event_api_limit_reached
  • Event_plugin_disabled
  • Event_plugin_enabled
  • Event_plugin_subscription_expired
  • Event_plugin_subscription_renewed
  • Event_plugin_subscription_started
  • Event_test
  • Filipino
  • French
  • German
  • Hebrew
  • Hindi
  • Indonesian
  • Italian
  • Japanese
  • Korean
  • Persian
  • Portuguese
  • Russian
  • Spanish
  • Swedish
  • Turkish
  • Urdu
  • Vietnamese

Plugin enabled

Plugin enabled Plugin enabled

Plugin enabled

Plugin enabled Plugin enabled

Plugin enabled

Plugin enabled

Plugin enabled

Plugin enabled Plugin enabled

Plugin enabled

Plugin enabled Plugin enabled Plugin enabled Plugin enabled
Plugin enabled
Plugin enabled
Plugin enabled
Plugin enabled
Plugin enabled
Plugin enabled

Plugin enabled Plugin enabled

Posts

Plugin enabled

Plugin enabled

Plugin enabled

Plugin enabled

Plugin enabled

Plugin enabled

Plugin enabled

fxstreetforex
fxstreetforex
1 Plugin enabled ยทPlugin enabled

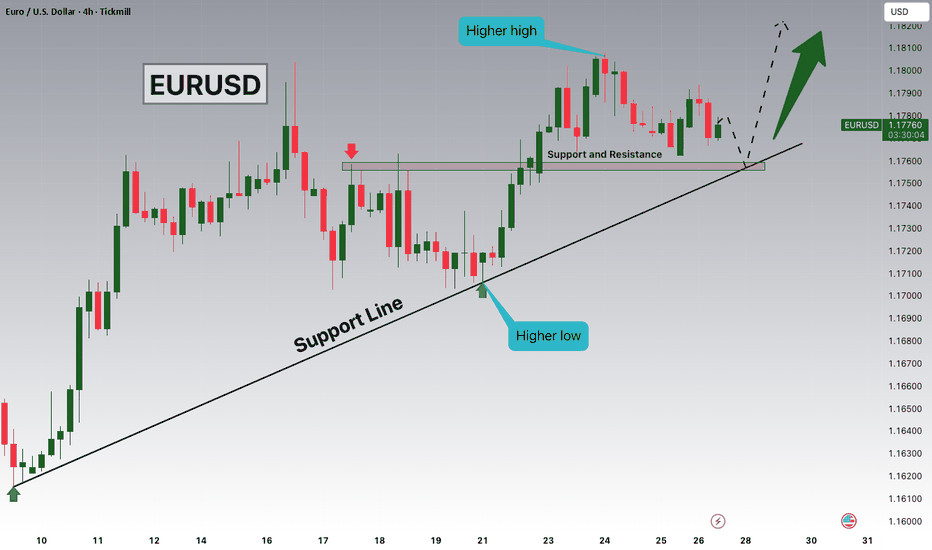
GBP/USD gathers strength above 1.3450 on Fed rate cut bets, BoE's gradual policy pathThe GBP/USD pair gathers strength to around 1.3480 during the early Asian session on Friday. Expectations of the US Federal Reserve (Fed) rate cuts this year weigh on the US Dollar (USD) against the Pound Sterling (GBP). Philadelphia Fed President Anna Paulson is set to speak later on the

image
Plugin enabled
Plugin enabled
Plugin enabled
ideas_EURUSD
ideas_EURUSD
1 Plugin enabled ยทPlugin enabled

EURUSD Pullback Toward 1.17500 Keeps Bullish Structure Intact
Hey Traders,
In todays trading session, we are monitoring EURUSD for a potential buying opportunity around the 1.17500 zone.
The pair remains in a well-defined uptrend and is currently undergoing a healthy corrective move. Price is approaching the 1.17500 area, a key zone of confluence where trend support aligns with a former support/resistance level. This area has previously attracted strong participation, making it technically significant.
As long as this level holds, the broader bullish structure remains intact, and a positive reaction here could support a continuation toward recent highs.
don't forget to support us with boost and leave your opinion on the comment section!
Trade safe,
Joe

image
Plugin enabled
Plugin enabled
Plugin enabled
ideas_BTCUSDT
ideas_BTCUSDT
1 Plugin enabled ยทPlugin enabled

Risk Management: The Art of Long-Term Survival
Risk Management
Imagine a hero standing at a crossroads with three paths.
If he takes the road to the right, he will face a serious challenge with a difficulty level of 100. At the end of this path, however, he will be rewarded with five gold bars.
The middle road leads to ten gold bars, but the hero will encounter not one, but three challenges along the way. Each of them is no less difficult than the one on the right-hand road. Taken together, their total difficulty amounts to 300.
The left road involves a less demanding challenge with a difficulty of 60, but the reward is modest only one gold bar.
Which path would you choose if you were in the heros place?
Now suppose the hero chose a balanced level of risk, but along the way he was bitten by a snake and never even reached the challenge.
This is exactly what risk-taking in financial markets looks like.
In the real world, risk is first and foremost the probability of loss.
Risk is an inevitable consequence of the fact that the future is unknown. At any given moment, there are far more possible outcomes than those that ultimately materialize. It is precisely this gap between the range of potential outcomes and the single realized result that gives rise to risk. The future cannot be viewed as a predetermined or predictable script; it is a spectrum of possibilities that includes both favorable and unfavorable outcomes.
An investor may estimate the range of the most likely scenarios and base their expectations of the future on them. However, even the most probable event offers no guarantee that it will actually occur.
Risk comes in many forms, and the probability of loss is only one of them. Another important type is the risk of missed opportunities the risk of taking too little risk. Stayin

image
Plugin enabled
Plugin enabled
Plugin enabled
Ideas_XAUUSD
Ideas_XAUUSD
1 Plugin enabled ยทPlugin enabled

XAUUSD Bullish Continuation Setup (30M)
Buy Zone: 4,520 4,530
Stop Loss:Below 4,500
Targets
TP1: 4,550
TP2: 4,600 4,610
Price is holding above ascending trendline and key demand. Bullish structure remains intact. A clean break and hold above resistance can trigger continuation toward the upper target zone.

image
Plugin enabled
Plugin enabled
Plugin enabled
fxstreetforex
fxstreetforex
1 Plugin enabled ยทPlugin enabled

Gold Price Forecast: XAU/USD climbs to near $4,350 on Fed rate cut bets, geopolitical risks Gold price (XAU/USD) rises to near $4,345 during the early Asian session on Friday. Gold finished2025with a significant rally, achieving an annual gain of around65%, its biggest annual gain since

image
Plugin enabled
Plugin enabled
Plugin enabled
ideas_EURUSD
ideas_EURUSD
1 Plugin enabled ยทPlugin enabled

EUR/USD) Bullish trend analysis Read The caption
SMC Trading point update
Technical analysis of EURUSD 2H chart using SMC + Fibonacci OTE + EMA trend continuation.

Market Context
Bias: Bullish continuation
Overall structure shows higher highs & higher lows
Strong impulsive move followed by healthy corrective channels
Price is holding above EMA 200, confirming HTF bullish bias
EMA 50 is acting as dynamic intraday support

What Price Is Doing
After a strong bullish displacement, price entered a descending corrective channel
That channel has now broken to the upside (bullish BOS)
Current pullback is a retest / re-accumulation, not weakness
This is classic trend correction continuation behavior.

Key Buy Zone (Blue Area)
~1.1735 1.1750
Why this zone is high-probability:
SMC demand / order block
Fib OTE zone (0.705 0.79)
EMA 50 + EMA 200 confluence
Previous resistance support flip
Multiple reactions already marked (green arrows)
This zone represents institutional rebalance, not retail buying.

Fibonacci Logic
Measured from the latest impulse low swing high:
0.5 / 0.62 = shallow pullback
0.705 0.79 = optimal trade entry (OTE)
Textbook continuation location in a bullish market

Trade Idea (Continuation Long)
Buy on confirmation inside demand
Entry: 1.1735 1.1750
Stop Loss: Below demand (~1.171
Targets:
TP1: 1.1780 (recent high)
TP2: 1.1820
Final TP: 1.1880 1.1890 (marked target point / liquidity above highs)
RiskReward: ~1:3+

Confirmation Triggers (Important)
Only take the trade if you see:
Bullish engulfing or strong rejection wick from the zone
Lower-timeframe CHoCH
Failure to accept below the OTE zone
Momentum

image
Plugin enabled
Plugin enabled
Plugin enabled
ideas_BTCUSDT
ideas_BTCUSDT
1 Plugin enabled ยทPlugin enabled

Bitcoin The Big Liquidity Hunt is Coming!
Bitcoin's price is controlled by banks and governments. They won't allow the price to move until they have acquired the liquidity they need.
Before trading, you should always think about where most retail traders have placed their stop losses. They don't care if you lose; they're after liquidity.
But if you can identify these liquidity pools, you can ride along with the big banks and institutions and profit.
If technical analysis accounts for 20%, psychology is 80% of the story.
The timeframe for this analysis is 4 hours
On the chart, we've marked liquidity pools places where most traders have set their stops with $$$ signs.
The price has been ranging in this zone for 36 days. What happens each time? Liquidity pools form, these pools get swept, and then the price moves.
Now, the liquidity pools we've marked at the lows in red have not yet been swept, and most traders in long positions have their stops just below these two lows. The range from 83,764 to 82,412 is exactly where long traders stop losses will be hit, short positions will increase in size, and it is the best zone for a trend reversal.
There are many traders with a bearish view on Bitcoin but guess what happens if these two lows are hit? Longs get stopped out, traders in short positions either add to their size or new shorts join inand that is exactly where the price will bounce back upwards.
Trading is not hard or complicated if you have a professional coach.
If you have a coin or altcoin you want analyzed, first hit the like button and then comment its name so I can review it for you.
This is not a trade setup, as it has no precise stop-loss, stop, or target. I do not publish my trade setups here.

image
Plugin enabled
Plugin enabled
Plugin enabled
Ideas_XAUUSD
Ideas_XAUUSD
1 Plugin enabled ยทPlugin enabled

Lingrid | GOLD Weekly Outlook: Consolidating for the Climb
OANDA:XAUUSD perfectly played out my previous weekly idea . Gold push toward $4,500 has stalled as bullish momentum wanes ahead of year-end, with price now testing the upper boundary of its recent range near $4,530. 4H chart clearly shows the market is losing steam, hinting at a short-term pullback toward the $4,440 support zonea natural pause after a strong run. This is consolidation within a powerful uptrend defined by higher lows and a clear upward channel. The macro backdrop remains firmly supportive: central banks are still buying, geopolitics are volatile, and real yields stay low. This dip is not a warningits an opportunity to add to long positions with disciplined risk management.
The bullish market structure remains intact. Key support sits at $4,440, reinforced by the rising trendline. A break below $4,400 could trigger a deeper correction toward $4,250, but that would likely be a shallow retracement before resuming the climb. Conversely, a decisive close above weekly opens the door to fresh all-time highs in the $4,650 and higher, where resistance is thin. We should watch for bullish reversals on the 4H chart near support. TVC:GOLD s bull market is structural, not seasonal. This holiday slowdown is just the bull catching its breathdont mistake it for fatigue. The next surge is already being prepared and 2026 could start with it.
If this idea resonates with you or you have your own opinion, traders, hit the comments. Im excited to read your thoughts!

image
Plugin enabled
Plugin enabled
Plugin enabled
fxstreetforex
fxstreetforex
1 Plugin enabled ยทPlugin enabled

Ready to trade Gold? Heres what you need to know! Gold is one of the most traded assets, but success comes down to knowing the key details and choosing the right broker.WeveIn our latest article: How to get started with Gold trading Leverage options and what they mean Gold CFDs explained - why they matterRead the full guide here: Weve ranked the top brokers for Gold so you can trade smarter, not harder!
Best Brokers for Gold Trading in 2026 - FXStreetReady to trade gold? Our complete guide reviews the best brokers for gold trading in 2025 and discuss their characteristics, platforms, and conditions.

image
Plugin enabled
Plugin enabled
Plugin enabled
ideas_EURUSD
ideas_EURUSD
1 Plugin enabled ยทPlugin enabled

EURUSD: 1.1800 proved to be a strong resistance zone so far
It seems that EURUSD found a very strong resistance zone near 1.1800, as I explained in our previous analysis.
The price was rejected several times over the past two weeks, and near this area the chances of a move down increase.
Perhaps the USD could become stronger during January, given that the overall USD picture points to a strong USD.
The targets remain the same as before: 1.1675; 1.1595 and 1.1540
You may find more details in the chart!
Thank you and Good Luck!
PS: Please support with a like or comment if you find this analysis useful for your trading day

image
Plugin enabled
Plugin enabled
Plugin enabled
Showing 41 out of 274
  • 37
  • 38
  • 39
  • 40
  • 41
  • 42
  • 43
  • 44
  • 45
  • 46
  • 47
  • 48
  • 49
  • 50
  • 51
  • 52
  • 53
  • 54
  • 55
  • 56

Plugin enabled

Plugin enabled


Plugin enabled
Plugin enabled
Plugin enabled
Plugin enabled /home/xtreders.com/public_html/themes/wondertag/layout/modals/site-alerts.phtml on line 208

Warning: Trying to access array offset on value of type null in /home/xtreders.com/public_html/themes/wondertag/layout/modals/site-alerts.phtml on line 208
https://xtreders.com/setting&user=&page=monetization">Plugin enabled

Plugin enabled

Plugin enabled

Plugin enabled

Plugin enabled