Xtreders Xtreders
    #priceaction #kabhi_ta_trading #tradingview #supportresistance #cryptotrading
    Plugin enabled
  • Plugin enabled
  • Plugin enabled

  • Plugin enabled

    Plugin enabled Plugin enabled

  • Arabic
  • Bengali
  • Chinese
  • Croatian
  • Danish
  • Dutch
  • English
  • Event_api_key_regenerated
  • Event_api_limit_reached
  • Event_plugin_disabled
  • Event_plugin_enabled
  • Event_plugin_subscription_expired
  • Event_plugin_subscription_renewed
  • Event_plugin_subscription_started
  • Event_test
  • Filipino
  • French
  • German
  • Hebrew
  • Hindi
  • Indonesian
  • Italian
  • Japanese
  • Korean
  • Persian
  • Portuguese
  • Russian
  • Spanish
  • Swedish
  • Turkish
  • Urdu
  • Vietnamese

Plugin enabled

Plugin enabled Plugin enabled

Plugin enabled

Plugin enabled Plugin enabled

Plugin enabled

Plugin enabled

Plugin enabled

Plugin enabled Plugin enabled

Plugin enabled

Plugin enabled Plugin enabled Plugin enabled Plugin enabled
Plugin enabled
Plugin enabled
Plugin enabled
Plugin enabled
Plugin enabled
Plugin enabled

Plugin enabled Plugin enabled

Posts

Plugin enabled

Plugin enabled

Plugin enabled

Plugin enabled

Plugin enabled

Plugin enabled

Plugin enabled

ideas_EURUSD
ideas_EURUSD
1 Plugin enabled ยทPlugin enabled

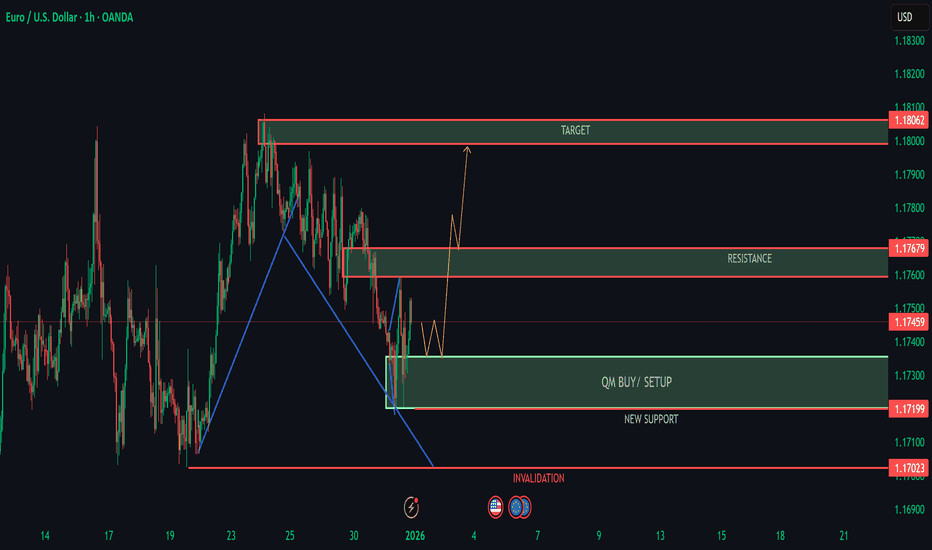
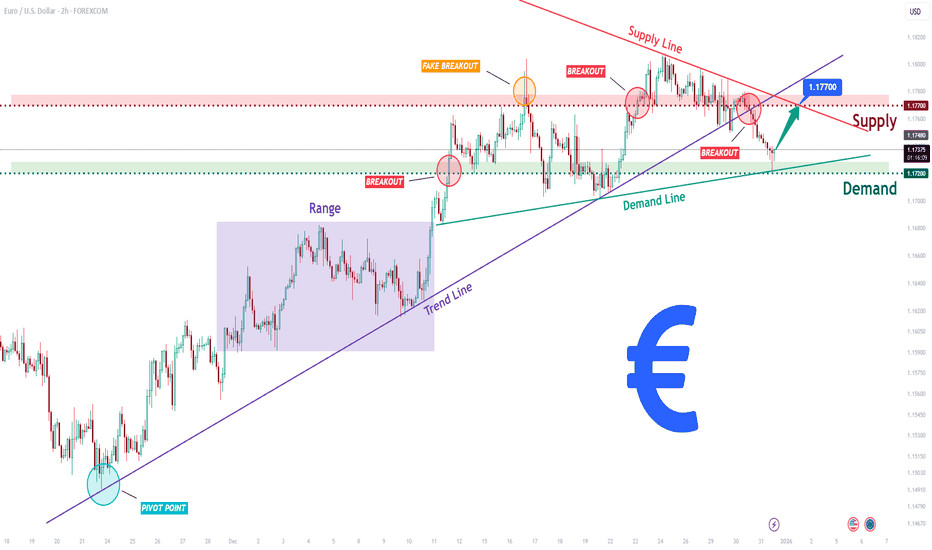
EURUSD Pullback Into New Support | Continuation Scenario
EURUSD has completed a structural breakout, flipping prior resistance into new support. Price is now pulling back into a clearly defined demand zone, where buyers previously stepped in aggressively.
The blue trendline shows the broader bullish structure remains intact, while current price action suggests consolidation before the next move. As long as price holds above the green support area, the bias favors continuation toward the higher resistance and target zone.
Failure to hold this support would invalidate the setup and signal deeper retracement, making this area a key decision point for the market.
Compression after expansion often leads to another impulse patience and confirmation are key.
Educational idea only. Not financial advice

image
Plugin enabled
Plugin enabled
Plugin enabled
ideas_BTCUSDT
ideas_BTCUSDT
1 Plugin enabled ยทPlugin enabled

BTCUSDT Bulls Defend Range Support, Eyes on $90,500
Hello traders! Heres my technical outlook on BTCUSDT (4H) based on the current chart structure. BTCUSDT previously broke down from a descending triangle structure, confirming bearish control and leading to a strong impulsive move lower. After this decline, price found a base and transitioned into a broad range, where buyers and sellers have been in relative balance. Multiple internal breakouts within the range highlight volatility but no clear trend dominance during this phase. Recently, price bounced from the lower boundary of the range and the rising Support Line, showing clear buyer reaction and a short-term shift in momentum. BTC is now trading above the key 87,300 Support Zone, which aligns with previous range support and a recent breakout level. The latest move higher looks constructive, with price attempting to challenge the upper part of the range. My scenario: as long as BTCUSDT holds above the 87,300 support area, the bias remains mildly bullish. A sustained move higher could lead to a retest of the 90,500 Resistance and TP1 near the range highs. Acceptance above resistance would open the door for further upside expansion. However, failure to hold support and a breakdown back into the lower range would invalidate the bullish scenario and favor renewed consolidation or downside. For now, the focus remains on support holding and reaction near resistance. Please share this idea with your friends and click Boost

image
Plugin enabled
Plugin enabled
Plugin enabled
Ideas_XAUUSD
Ideas_XAUUSD
1 Plugin enabled ยทPlugin enabled

XAUUSD respecting descending channel structure.
Price is trading inside a well-defined descending channel and is currently reacting from the lower boundary.
The support zone has previously held multiple times, suggesting a potential bullish response if structure remains intact.
A break and hold below support would invalidate this view.
Waiting for confirmation from price action.

image
Plugin enabled
Plugin enabled
Plugin enabled
fxstreetforex
fxstreetforex
1 Plugin enabled ยทPlugin enabled

US Dollar Index declines to near 98.00 on Fed independence worries, rate cut betsThe USDollar Index (DXY), an index of the value of theUS Dollar (USD) measured against a basket of six world currencies,tradeson a softer note near 98.15 during the Asian trading hours. Traders brace for US economic data this month to gauge the path of interest

image
Plugin enabled
Plugin enabled
Plugin enabled
ideas_EURUSD
ideas_EURUSD
1 Plugin enabled ยทPlugin enabled

EURUSD Holding Buyer Zone - Rebound Toward 1.1780 in Focus
Hello traders! Heres my technical outlook on EURUSD (2H) based on the current chart structure. EURUSD is trading within a broader bullish structure after a strong upside move from the lower levels. Earlier, price advanced inside an ascending channel, confirming sustained buyer control and a sequence of higher highs and higher lows. Following this impulsive rally, EURUSD broke above a key structure level and transitioned into a consolidation phase near the highs. Currently, price is reacting around the Buyer Zone near 1.1740, which aligns with a key Support Level and a previous breakout area. This zone has already shown multiple reactions, indicating active demand. Above, the market remains capped by a descending Resistance Line and the Seller Zone around 1.1780, where selling pressure previously caused a rejection. The recent move into support appears corrective rather than impulsive, suggesting a pause within the broader bullish trend. My scenario: as long as EURUSD holds above the 1.1740 Buyer Zone, the bullish structure remains intact. A strong reaction from this area could lead to another push toward the 1.1780 Resistance Level (TP1). A confirmed breakout and acceptance above resistance would open the door for further upside continuation. However, a decisive breakdown below the buyer zone would weaken the bullish setup and signal a deeper corrective move toward lower support levels. For now, price remains at a key decision area, with buyers defending structure while consolidation continues. Please share this idea with your friends and click Boost

image
Plugin enabled
Plugin enabled
Plugin enabled
ideas_BTCUSDT
ideas_BTCUSDT
1 Plugin enabled ยทPlugin enabled

BTCUSDT Long: Compression Signals Big Move Ahead
Hello traders! Heres a clear technical breakdown of BTCUSDT (2H) based on the current chart structure. Bitcoin is trading within a broad consolidation after a strong bearish impulse earlier in the chart. Following the sell-off, price formed a key pivot low, from which a rising demand trend line has been established, indicating that buyers are gradually stepping back into the market. Since that pivot, BTC has been oscillating between a clearly defined Supply zone near 89,000 and a Demand zone around 86,800, creating a compression structure.
Currently, BTC is holding above the demand zone and reacting constructively from the lower boundary of the structure. The latest pullback into demand appears corrective rather than impulsive, signaling that sellers are losing momentum at these levels.
My scenario: as long as BTCUSDT holds above the 86,800 demand zone, the structure remains neutral-to-bullish. A strong reaction from demand could lead to another attempt toward the 89,000 supply, and a confirmed breakout above this level would open the door for upside continuation. A decisive breakdown below demand would invalidate the bullish bias and shift focus to lower levels. For now, price remains compressed between supply and demand, with buyers gradually defending structure. Manage your risk!

image
Plugin enabled
Plugin enabled
Plugin enabled
Ideas_XAUUSD
Ideas_XAUUSD
1 Plugin enabled ยทPlugin enabled

XAUUSD A Healthy Reset Before Trend Continuation
Hello, Im Camila.
Observing the XAUUSD H4 chart, I believe the market is unfolding exactly as a technical correction within a well-defined uptrend. After price was rejected at the upper resistance of the ascending channel, gold deliberately pulled back to retest the channels dynamic support. This move should not be interpreted as a trend reversal, but rather as a natural and rational response following a steep and extended rally.
What stands out to me is how price behaves upon reaching the support zone. Selling pressure has not expanded further; instead, downside momentum has clearly slowed, accompanied by signs of supply absorption at the highlighted support area. This is classic price behavior in a healthy uptrend: the market retraces to lower levels to assess whether buyers remain committed to defending the underlying structure.
From a structural perspective, the ascending channel remains intact. Price has not broken below the lower boundary of the channel, and the entire pullback still falls well within acceptable corrective limits. This indicates that the medium-term bullish trend remains unbroken. I see no clear evidence of distribution at this stage; rather, the market appears to be undergoing a temporary rebalancing of supply and demand before the primary trend resumes.
My preferred scenario is for gold to stabilize and consolidate around the dynamic support zone, marked as a BUY area on the chart. If buying interest continues to emerge and price maintains its higher-low structure, the market is likely to form a technical rebound. From there, gold could move back toward a retest of the upper resistance zone previously highlighted. A decisive breakout above that area would confirm trend continuation and open the door to higher targets in the next phas

image
Plugin enabled
Plugin enabled
Plugin enabled
fxstreetforex
fxstreetforex
1 Plugin enabled ยทPlugin enabled

AUD/USD rises to near 0.6700 as RBA rate hike bets emergeAUD/USD rises more than 0.25% after after remaining flat in the previous session, trading around 0.6690 during the Asian hours on Friday. The pair gains as the Australian Dollar (AUD) finds support amid growing expectations of interest rate hikes from the Reserve Bank of Australia

image
Plugin enabled
Plugin enabled
Plugin enabled
ideas_EURUSD
ideas_EURUSD
1 Plugin enabled ยทPlugin enabled

EURUSD Long: Demand at 1.1720 Sets Up a Push Toward 1.1770
Hello traders! Heres a clear technical breakdown of EURUSD (2H) based on the current chart structure. After forming a solid pivot low, EURUSD transitioned into a bullish trend, supported by a rising trend line that guided price action higher. Following this move, the market entered a consolidation range, signaling temporary balance before the next expansion phase. Price later broke out of the range to the upside, confirming renewed buyer strength. However, upon reaching the upper Supply Zone near 1.17701.1780, EURUSD experienced a fake breakout, followed by rejection and increased selling pressure. This rejection highlighted active sellers defending supply. Despite this, buyers managed to push price higher again, leading to another breakout attempt above supply, though momentum remained limited.
Currently, EURUSD is pulling back from the supply area and is trading near the Demand Zone around 1.1720, which aligns with the rising demand line and prior breakout structure. This zone represents a key decision area, where buyers may attempt to defend the bullish structure.
My scenario: as long as EURUSD holds above the 1.1720 Demand Zone, the broader bullish structure remains intact, and the pullback can be considered corrective. A strong reaction from demand could lead to another test of the 1.1770 Supply Zone. However, a decisive breakdown below demand would signal a loss of bullish control and open the door for a deeper corrective move. For now, price is at a critical level, with demand acting as the key area to watch. Manage your risk!

image
Plugin enabled
Plugin enabled
Plugin enabled
ideas_BTCUSDT
ideas_BTCUSDT
1 Plugin enabled ยทPlugin enabled

BTCUSDT Above Support - $88,900 Resistance in Play
Hello traders! Heres my technical outlook on BTCUSDT (1H) based on the current chart structure. BTCUSDT is trading within a broader ascending channel, confirming an overall bullish structure despite recent volatility. After a sharp drop earlier on the chart, price formed a clear base and started to grow, establishing higher lows along the channels support line. This recovery phase shows that buyers remain active and are defending key levels. Price then moved into a consolidation area between a clearly defined Buyer Zone (support) and Seller Zone (resistance), creating a range-like environment inside the channel. Multiple breakouts and false moves around the Seller Zone highlight strong supply pressure in this area, while repeated defenses of the Buyer Zone confirm solid demand. The dashed midline reflects interim structure guiding price action within the channel. Currently, BTC is holding above the Support Level around the Buyer Zone (~87,30, while facing overhead Resistance near the Seller Zone (~88,90. The projected move suggests a potential bounce from support toward resistance, with TP1 aligned near the upper resistance area inside the channel. My scenario: as long as BTCUSDT holds above the Buyer Zone and the ascending support line, the bias remains bullish, with a move toward the resistance and TP1 as the primary objective. A strong rejection from resistance could lead to further consolidation. However, a clean breakdown below support would invalidate the bullish setup and signal a deeper pullback. Please share this idea with your friends and click Boost

image
Plugin enabled
Plugin enabled
Plugin enabled
Showing 40 out of 275
  • 36
  • 37
  • 38
  • 39
  • 40
  • 41
  • 42
  • 43
  • 44
  • 45
  • 46
  • 47
  • 48
  • 49
  • 50
  • 51
  • 52
  • 53
  • 54
  • 55

Plugin enabled

Plugin enabled


Plugin enabled
Plugin enabled
Plugin enabled
Plugin enabled /home/xtreders.com/public_html/themes/wondertag/layout/modals/site-alerts.phtml on line 208

Warning: Trying to access array offset on value of type null in /home/xtreders.com/public_html/themes/wondertag/layout/modals/site-alerts.phtml on line 208
https://xtreders.com/setting&user=&page=monetization">Plugin enabled

Plugin enabled

Plugin enabled

Plugin enabled

Plugin enabled