Xtreders Xtreders
    #priceaction #kabhi_ta_trading #tradingview #supportresistance #cryptotrading
    Plugin enabled
  • Plugin enabled
  • Plugin enabled

  • Plugin enabled

    Plugin enabled Plugin enabled

  • Arabic
  • Bengali
  • Chinese
  • Croatian
  • Danish
  • Dutch
  • English
  • Event_api_key_regenerated
  • Event_api_limit_reached
  • Event_plugin_disabled
  • Event_plugin_enabled
  • Event_plugin_subscription_expired
  • Event_plugin_subscription_renewed
  • Event_plugin_subscription_started
  • Event_test
  • Filipino
  • French
  • German
  • Hebrew
  • Hindi
  • Indonesian
  • Italian
  • Japanese
  • Korean
  • Persian
  • Portuguese
  • Russian
  • Spanish
  • Swedish
  • Turkish
  • Urdu
  • Vietnamese

Plugin enabled

Plugin enabled Plugin enabled

Plugin enabled

Plugin enabled Plugin enabled

Plugin enabled

Plugin enabled

Plugin enabled

Plugin enabled Plugin enabled

Plugin enabled

Plugin enabled Plugin enabled Plugin enabled Plugin enabled
Plugin enabled
Plugin enabled
Plugin enabled
Plugin enabled
Plugin enabled
Plugin enabled

Plugin enabled Plugin enabled

Posts

Plugin enabled

Plugin enabled

Plugin enabled

Plugin enabled

Plugin enabled

Plugin enabled

Plugin enabled

ideas_EURUSD
ideas_EURUSD
2 Plugin enabled ยทPlugin enabled

EURUSD: Bullish Structure Holds - Market Eyes 1.1810 Resistance
Hello everyone, here is my breakdown of the current EURUSD setup.
Market Analysis
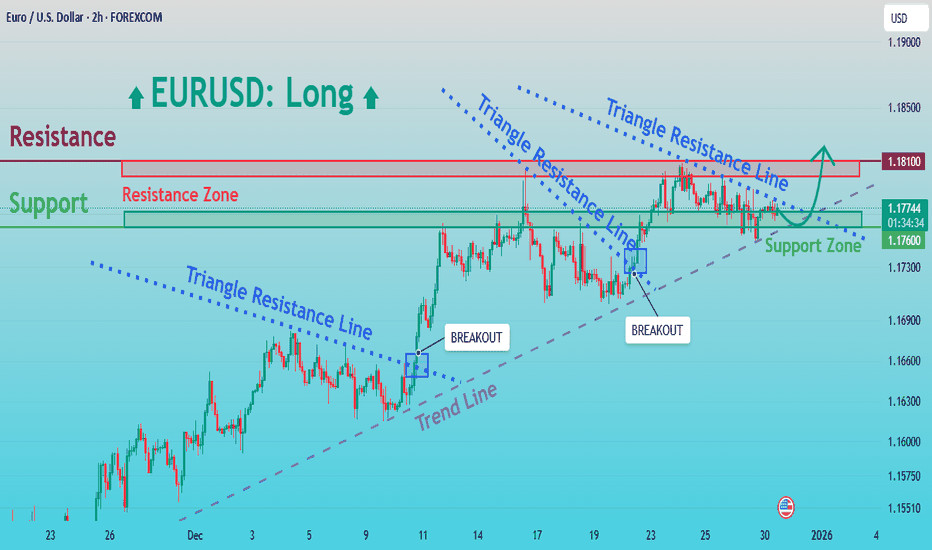
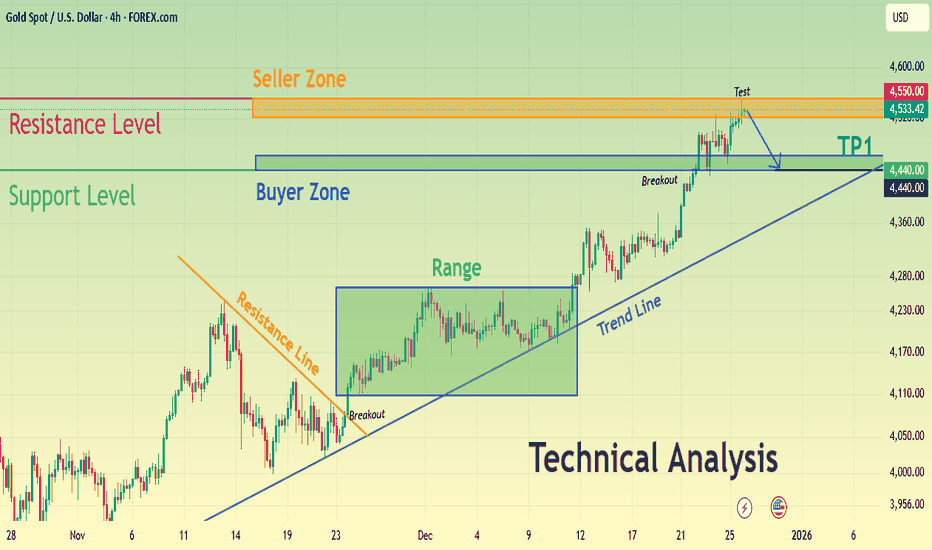
EURUSD is trading within a well-defined bullish structure after breaking out of a descending triangle formation, signaling a clear shift in control from sellers to buyers. The initial breakout was followed by a brief consolidation phase, where price formed a tight range, suggesting accumulation rather than distribution. After this pause, the pair continued higher and successfully broke above the triangle resistance line, confirming bullish continuation.
Currently, EURUSD is trading above a rising trend line, which continues to act as dynamic support. The market recently tested the Resistance Zone around 1.1810, where selling pressure appeared, leading to a short-term pullback. This retracement is now developing toward the Support Zone near 1.1760, which aligns with the previous breakout area and the ascending structure. As long as price holds above this support, the broader bullish trend remains intact and the pullback appears corrective.
My Scenario & Strategy
My primary scenario remains bullish while EURUSD holds above the 1.1760 Support Zone. I expect buyers to defend this area and push price higher for another attempt toward the 1.1810 Resistance Zone.
Therefore, a clean breakout and acceptance above resistance would confirm bullish continuation and open the way for further upside expansion. However, a decisive breakdown below support would weaken the structure and signal a deeper correction. For now, price action continues to favor buyers as long as the ascending structure holds.
That's the setup I'm tracking. Thank you for your attention, and always manage your risk.

image
Plugin enabled
Plugin enabled
Plugin enabled
ideas_BTCUSDT
ideas_BTCUSDT
2 Plugin enabled ยทPlugin enabled

Bitcoin will die! Silver pumped +200% - GOLD (2026 prediction)
Bitcoin will die in 2026, and a lot of traders will get liquidated! Silver pumped by 200% this year, gold by 75%, and the US stock index Nasdaq by 61%, while Bitcoin dropped from 126k to 80k in 2025. I will tell you exactly why in this analysis!
First, let's take a look at Bitcoin and the main reason behind this drop. If you started investing in Bitcoin, I have to warn you because the total market capitalization is already extremely big. In other words, Bitcoin will never go up exponentially as it did in previous years! You are late to the Ponzi, so forget about 10x or 50x profit. The price of Bitcoin, the code of Bitcoin, and the future of Bitcoin are completely controlled by the banks and huge institutions. Crypto technology is not new in the galaxy, it has been brought to planet Earth by aliens. So why is Bitcoin going down? As an investor, you should probably know that Bitcoin experiences halving events +- every 4 years. From a technical point of view, we have 3 years of growth and 1 year of sharp decline. We already had the 3-year growth cycle (2022-2025), so we can expect a massive drop in 2026. How low can Bitcoin go? My prediction is 40k to 60k.
What about silver and gold? Why are these precious metals going up like crazy? Mostly because the price has been kept very low for a very long time. The banks did their best to keep the price low. Over 99% of gold and silver is in a virtual form or in the form of contracts. So they artificially decreased the price of these metals for their own benefits. There are still people who think that gold, silver, and Bitcoin are enemies to the traditional banking system and banks in general. That is 100% false; in fact, it's the opposite - they love them. Banks make money mostly on providing services, such as keeping your money

image
Plugin enabled
Plugin enabled
Plugin enabled
Ideas_XAUUSD
Ideas_XAUUSD
2 Plugin enabled ยทPlugin enabled

XAU/USD | Gold Sharp Sell-Off After ATH, Liquidity Void in Play!
By analyzing the #gold chart on the 4H timeframe, we can see that after our last analysis, price rallied to $4550 and delivered over 700 more pips of profit. After that strong move, gold entered a very aggressive correction. In less than 16 hours, price dropped from $4550 to $4300, which means a $250 or 2500 pips heavy sell-off.
Right now, gold is trading around $4329. This sharp drop has created a very large liquidity void, and I expect this gap to be filled in the short term with a bullish rebound. The expected short-term upside is around 300 to 800 pips, while the medium-term potential could reach 1500 to 2500 pips.
The key medium-term demand zone to watch is $4210 to $4269.This analysis will be updated.
Please support me with your likes and comments to motivate me to share more analysis with you and share your opinion about the possible trend of this chart with me !
Best Regards , Arman Shaban

image
Plugin enabled
Plugin enabled
Plugin enabled
fxstreetforex
fxstreetforex
2 Plugin enabled ยทPlugin enabled

Dow Jones Industrial Average softens on final trading day of 2025US equities pulled back modestly midweek, but the broader picture for investors remains one of a strong year nearing its conclusion. The S&P 500 slipped about 0.2% on Wednesday, matching declines in the Nasdaq Composite, while the Dow Jones Industrial Average fell roughly

image
Plugin enabled
Plugin enabled
Plugin enabled
ideas_EURUSD
ideas_EURUSD
2 Plugin enabled ยทPlugin enabled

EURUSD Failed Break Above 1.1800 Opens Path to 1.1740
Hello traders! Heres my technical outlook on EURUSD (4H) based on the current chart structure. EURUSD is trading within a broader bullish structure after breaking above a descending resistance formation earlier on the chart, signaling a clear shift in market control from sellers to buyers. Following this breakout, price entered a consolidation phase, forming a well-defined range, which reflected temporary balance before trend continuation. The subsequent upside breakout from this range, supported by a rising trend line, confirmed renewed bullish momentum and continuation of the upward structure. Currently, price is testing a key Resistance Level near 1.1800, where a fake breakout has already occurred, suggesting potential exhaustion of buyers at the highs. This resistance aligns with a descending resistance line, increasing the probability of seller reaction. Below current price, the former resistance has flipped into a Support Level around 1.1740, overlapping with the Buyer Zone and the previous breakout area, making it a critical demand region. My scenario: as long as price is rejected from the 1.1800 resistance, a corrective move toward 1.1740 is likely (TP1). A clean breakdown below support would open the door for a deeper pullback. A confirmed breakout above 1.1800 would invalidate the short bias and signal further upside. Please share this idea with your friends and click Boost

image
Plugin enabled
Plugin enabled
Plugin enabled
ideas_BTCUSDT
ideas_BTCUSDT
2 Plugin enabled ยทPlugin enabled

The Boredom Stage of Trading - Why Most Traders Quit Here
Good morning, all, thank you all for coming today.
Today we will be looking into the Boredom Phase of trading, and why most new traders quit because of it. Lets begin.
What Is the Boredom stage during Trading?
Boredom in trading is the stage where the excitement goes away, but the results have not arrived yet.
You are no longer a beginner filled with hype, joy and excitement.
You are aware of, and understand the basics, you have a strategy, and you know what you should be doing.
Yet progress feels slow , repetitive , and unrewarding .
There are less trades, fewer emotional highs, and long stages of patiently waiting.
This is where trading begins to feel boring , and for many traders, boredom feels like failure, it feels like they are failing since they are not doing anything.
This phase is not a sign you are doing something wrong it is a sign you are doing something right .
How the Boredom stage Affects Traders
Boredom secretly ruins traders because it does not feel dangerous.
During this period, traders will often:
Start forcing trades just to feel active or alive like they are doing something.
Break rules out of impatience ( breaking their own system )
Abandon strategies that are working ( same as above )
Chase excitement instead of probability ( they seek the 100x return )
Confuse no trades with no progress ( If you follow your system and wait, you are making progress )
The market rewards patience, but boredom pushes traders toward action.
This creates losses, frustration, and eventually self-doubt. ( Which no one wants )
Many traders do not fail because they lack knowledge or skill. They fail because they cannot tolerate stillness. ( They psychology weakens when they face bored

image
Plugin enabled
Plugin enabled
Plugin enabled
Ideas_XAUUSD
Ideas_XAUUSD  Plugin enabled
2 Plugin enabled

image
Plugin enabled
Plugin enabled
Plugin enabled
Ideas_XAUUSD
Ideas_XAUUSD
2 Plugin enabled ยทPlugin enabled

XAUUSD Sellers Defend Resistance, Eyes on Pullback
Hello traders! Heres my technical outlook on XAUUSD (4H) based on the current chart structure. Gold remains in a bullish structure after breaking above a descending resistance line, confirming a shift in control to buyers. Price then consolidated in a clear range, showing balanced market activity before continuing higher. The upside breakout from this range, supported by a rising trend line, confirms ongoing bullish momentum. Currently, XAUUSD is testing a key Resistance Level within the Seller Zone, where selling pressure may appear. Below, the former resistance has turned into a strong Support Level, aligned with the Buyer Zone near 4,440 and the previous breakout area. My scenario: as long as price remains below the Seller Zone and shows rejection from resistance, the bias turns bearish, with TP1 targeting a move back toward the Buyer Zone and trend-line support. A strong breakout and acceptance above resistance would invalidate the short scenario and suggest further upside continuation. Please share this idea with your friends and click Boost

image
Plugin enabled
Plugin enabled
Plugin enabled
fxstreetforex
fxstreetforex
2 Plugin enabled ยทPlugin enabled

Curious about MetaTrader 4 (MT4) and how it can enhance your trading experience?Heres what you need to know: MT4 vs. MT5 Which one suits your strategy? Is MT4 safe? Security insights you can trust Are there fees? Get the cost breakdown Best MT4 Brokers in 2025 Find your perfect broker! Your ultimate MT4 guide is here!Read it now

image
Plugin enabled
Plugin enabled
Plugin enabled
fxstreetforex
fxstreetforex
2 Plugin enabled ยทPlugin enabled

Silver burns itself out as stocks retreat ahead of year endThe final trading week of 2025 has begun, and so far, theres not a Santa rally in sight. European stock futures are slightly higher as investors turn their backs on tech stocks, and US futures are lower as the Magnificent 7 get hit as we move to the end of the

image
Plugin enabled
Plugin enabled
Plugin enabled
Showing 46 out of 275
  • 42
  • 43
  • 44
  • 45
  • 46
  • 47
  • 48
  • 49
  • 50
  • 51
  • 52
  • 53
  • 54
  • 55
  • 56
  • 57
  • 58
  • 59
  • 60
  • 61

Plugin enabled

Plugin enabled


Plugin enabled
Plugin enabled
Plugin enabled
Plugin enabled /home/xtreders.com/public_html/themes/wondertag/layout/modals/site-alerts.phtml on line 208

Warning: Trying to access array offset on value of type null in /home/xtreders.com/public_html/themes/wondertag/layout/modals/site-alerts.phtml on line 208
https://xtreders.com/setting&user=&page=monetization">Plugin enabled

Plugin enabled

Plugin enabled

Plugin enabled

Plugin enabled