Xtreders Xtreders
    #priceaction #kabhi_ta_trading #tradingview #supportresistance #cryptotrading
    Plugin subscription started
  • Plugin subscription started
  • Plugin subscription started

  • Plugin subscription started

    Plugin subscription started Plugin subscription started

  • Arabic
  • Bengali
  • Chinese
  • Croatian
  • Danish
  • Dutch
  • English
  • Event_api_key_regenerated
  • Event_api_limit_reached
  • Event_plugin_disabled
  • Event_plugin_enabled
  • Event_plugin_subscription_expired
  • Event_plugin_subscription_renewed
  • Event_plugin_subscription_started
  • Event_test
  • Filipino
  • French
  • German
  • Hebrew
  • Hindi
  • Indonesian
  • Italian
  • Japanese
  • Korean
  • Persian
  • Portuguese
  • Russian
  • Spanish
  • Swedish
  • Turkish
  • Urdu
  • Vietnamese

Plugin subscription started

Plugin subscription started Plugin subscription started

Plugin subscription started

Plugin subscription started Plugin subscription started

Plugin subscription started

Plugin subscription started

Plugin subscription started

Plugin subscription started Plugin subscription started

Plugin subscription started

Plugin subscription started Plugin subscription started Plugin subscription started Plugin subscription started
Plugin subscription started

Plugin subscription started Plugin subscription started

Posts

Plugin subscription started

Plugin subscription started

Plugin subscription started

Plugin subscription started

Plugin subscription started

Plugin subscription started

Plugin subscription started

Ideas_XAUUSD
Ideas_XAUUSD
4 Plugin subscription started ยทPlugin subscription started

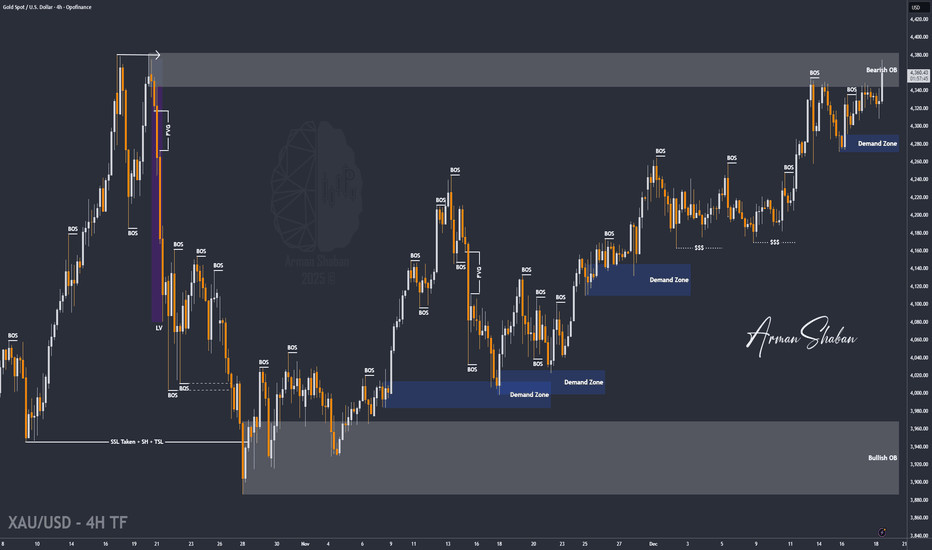
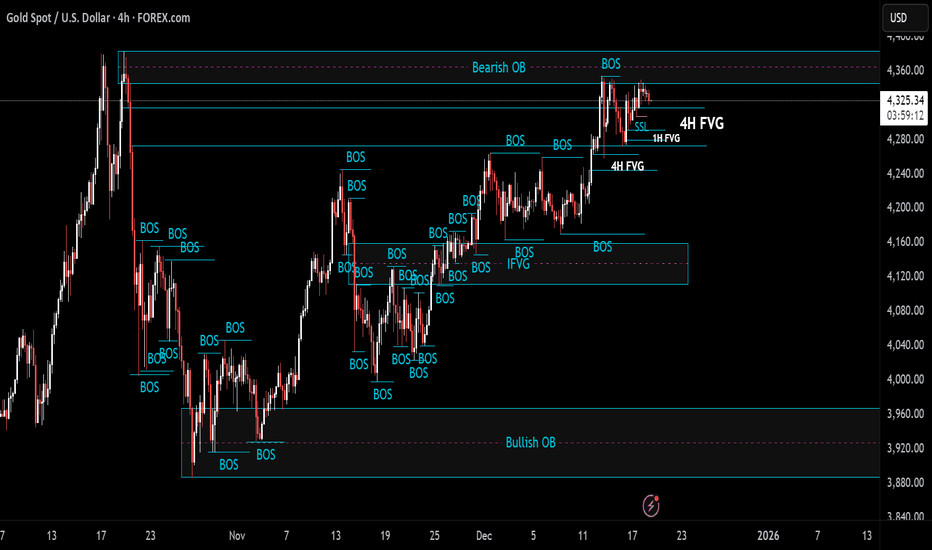
XAU/USD | Gold Near Previous ATH, Next Breakout in Focus!
By analyzing the #gold chart on the 4 hour timeframe, we can see that price moved exactly as expected and continued higher. Gold successfully hit the $4351 and $4359 targets and even pushed up to $4375.
Based on the main analysis, the next key target is a new all time high above $4382. Since gold has reached the very strong supply area around the previous ATH, the pullback we are seeing now is normal and has brought price back to around $4359. I expect a small correction first, followed by another bullish move and a fresh high. Targets above $4400 are clearly not out of reach.
Please support me with your likes and comments to motivate me to share more analysis with you and share your opinion about the possible trend of this chart with me !
Best Regards , Arman Shaban
The Related Analysis :

image
Plugin subscription started
fxstreetforex
fxstreetforex
4 Plugin subscription started ยทPlugin subscription started

Silver Price Analysis: XAG/SD surges to new all-time highs near $67.50Silver price rallies to a new all-time high of $67.45 even though US Treasury yields and the Dollar remained firm on Friday, amid the lack of catalysts, except for the US Consumer Sentiment poll made by the University of Michigan, which showed that US households are trimming spending on durable

image
Plugin subscription started
ideas_BTCUSDT
ideas_BTCUSDT
4 Plugin subscription started ยทPlugin subscription started

BTC/USDT - Demand Holding Strong (18.12.2025)
Description Market Structure WHITEBIT:BTCUSDT
BTC has formed a clear Double Bottom pattern inside a strong demand / support zone, signaling potential trend exhaustion on the downside. Price respected the support zone multiple times
Momentum is attempting to shift from sellers to buyers. This structure favors a bullish reversal if confirmation holds.
Trade Plan Bullish above the support zone
Entry Idea: Buy on pullback / breakout confirmation above trendline
1st Resistance: 91,900 92,000
2nd Resistance / Target: 94,100 94,200
#bitcoin #btcusdt #cryptotrading #doublebottom #priceaction #supportresistance #cryptoanalysis #tradingview #kabhi_ta_trading
Disclaimer
This analysis is for educational purposes only.
Crypto markets are volatile always use proper risk management and a stop-loss.
Support the Work Like if you see the reversal Comment: Bullish or Fakeout? Share with your crypto friends

image
Plugin subscription started
ideas_BTCUSDT
ideas_BTCUSDT
4 Plugin subscription started ยทPlugin subscription started

INTERVIEW: EXCAVO View 12/12/25
In my previous post, I invited you to ask any questions you had about the current market, the cycle structure, Bitcoin dominance, altcoins, timing, and everything in between.
You asked - and here are the detailed answers.
This is the continuation of our interview series.
I have taken every question from the comments, grouped them under your usernames, and provided full, transparent explanations based on my current market view.
Let's dive in.
@just5
Q:
Why do you say the bear market started in November? If it started earlier, why not in October?
Where does the 126k top come from?
Why is Bitcoin dominance so high?
Why haven't many altcoins (ETH, SOL) broken their previous highs? How far can they fall?
Your analysis is based on past cycles and fractals. Do you admit you can be wrong?
A:
I do not define the beginning of a bear market strictly by the date of the absolute top. For me, the trigger is the structure on the weekly timeframe. The formal high was reached in October, but the signal that confirmed the start of the bear phase was the first strong red weekly candle, which appeared in November. That is why I mark November as the beginning of the bear market.
The 126k level is not something random - the market simply traded there (around 126,250 USD depending on the exchange). So the level itself is not in question.
As for Bitcoin dominance - it is very simple. We have one main instrument in the market: BTC. It defines the weather for the entire crypto market.
When BTC rises, some alts rise and others lag.
When BTC falls, everything falls - especially assets with weaker liquidity or fundamentals.
Historically, people traded a lot of alt/BTC pairs. Many even believed altcoins were created mainly to accumulate more BTC. Today this logic still works: liquidity

image
Plugin subscription started
Ideas_XAUUSD
Ideas_XAUUSD
4 Plugin subscription started ยทPlugin subscription started

Gold (XAUUSD): Rising Wedge at a Critical Decision Zone
Hi guys!
Gold is currently trading inside a well-defined rising wedge, showing higher highs and higher lows, but with the price gradually compressing. This structure often signals a buildup before a strong directional move, making the current zone technically important.
On the upside, the 4,3854,400 resistance area remains the key level to watch. A strong 4H breakout above this zone would confirm bullish continuation and could open the door toward the 4,458 target, which aligns with the projected measured move of the wedge.
Scenario Analysis:
Bullish Case: A strong 4H close above wedge resistance and the 4,385 level would confirm a breakout, opening the path toward 4,458 as the primary upside target. Momentum continuation would be favored above this level.
Bearish Case: Failure to hold the rising wedge support, especially with strong bearish candles, would invalidate the structure and likely trigger a deeper corrective move into the highlighted demand zone.
Disclaimer: As part of ThinkMarkets Influencer Program, I am sponsored to share and publish their charts in my analysis.

image
Plugin subscription started
fxstreetforex
fxstreetforex
4 Plugin subscription started ยทPlugin subscription started

EUR surrenders post-ECB gains despite hawkish undertone ScotiabankThe Euro (EUR) failed to sustain gains following the European Central Bank (EC decision, even as unchanged rates and upgraded growth projections reinforced the view that the easing cycle has ended, Scotiabank's Chief FX Strategists Shaun Osborne and Eric Theoret

image
Plugin subscription started
ideas_EURUSD
ideas_EURUSD
4 Plugin subscription started ยทPlugin subscription started

Hellena | EUR/USD (4H): LONG to resistance area of 1.18000.
Colleagues, the price is successfully moving in an upward impulse 12345 in a medium-term wave 3.
I believe that this week we will see a continuation of the upward movement.
A slight correction to the support area of 1.17049 is possible to complete wave 4, followed by an update of the local maximum of the lower-order wave 3 and reaching the resistance area of 1.18000.
Manage your capital correctly and competently! Only enter trades based on reliable patterns!

image
Plugin subscription started
ideas_BTCUSDT
ideas_BTCUSDT
4 Plugin subscription started ยทPlugin subscription started

Market Phases Explained: Accumulation, Expansion, Distribution
Market Phases Explained: Accumulation, Expansion, Distribution, Reset
Difficulty: (Advanced)
Markets do not move randomly. They rotate through repeatable phases driven by liquidity, psychology, and participation. Understanding market phases helps traders stop forcing strategies and start trading in alignment with the current environment.
WHY MARKET PHASES MATTER
Most traders struggle not because their strategy is bad, but because they apply it in the wrong market phase.
Breakout strategies fail in accumulation
Mean-reversion fails during expansion
Trend-following fails in distribution
Reversal trading fails before reset is complete
Market phases explain when a strategy works, not just how .
Price action, indicators, and volume behave differently in each phase.
THE FOUR MARKET PHASES
Markets move in a repeating cycle:
Accumulation
Expansion
Distribution
Reset
Each phase has unique characteristics, risks, and opportunities.
1. ACCUMULATION (QUIET POSITIONING)
Accumulation occurs after a decline or prolonged sideways movement.
This is where smart money builds positions quietly.
Key characteristics:
Price moves sideways in a range
Volatility is low
Breakouts frequently fail
Volume is stable or slightly rising
What is really happening:
Large players accumulate positions without moving price too much. Liquidity is absorbed.
Indicator behavior:
RSI oscillates between 40 and 60
MACD hovers near the zero line
Volume spikes are quickly absorbed
Best strategies:
Range trading
Mean reversion
Patience and preparation
2. EXPANSION (TREND DEVELOPMENT)
Expansion begins when pr

image
Plugin subscription started
ideas_BTCUSDT
ideas_BTCUSDT
4 Plugin subscription started ยทPlugin subscription started

INTERVIEW: EXCAVO View 12/12/25
In my previous post, I invited you to ask any questions you had about the current market, the cycle structure, Bitcoin dominance, altcoins, timing, and everything in between.
You asked - and here are the detailed answers.
This is the continuation of our interview series.
I have taken every question from the comments, grouped them under your usernames, and provided full, transparent explanations based on my current market view.
Let's dive in.
@just5
Q:
Why do you say the bear market started in November? If it started earlier, why not in October?
Where does the 126k top come from?
Why is Bitcoin dominance so high?
Why haven't many altcoins (ETH, SOL) broken their previous highs? How far can they fall?
Your analysis is based on past cycles and fractals. Do you admit you can be wrong?
A:
I do not define the beginning of a bear market strictly by the date of the absolute top. For me, the trigger is the structure on the weekly timeframe. The formal high was reached in October, but the signal that confirmed the start of the bear phase was the first strong red weekly candle, which appeared in November. That is why I mark November as the beginning of the bear market.
The 126k level is not something random - the market simply traded there (around 126,250 USD depending on the exchange). So the level itself is not in question.
As for Bitcoin dominance - it is very simple. We have one main instrument in the market: BTC. It defines the weather for the entire crypto market.
When BTC rises, some alts rise and others lag.
When BTC falls, everything falls - especially assets with weaker liquidity or fundamentals.
Historically, people traded a lot of alt/BTC pairs. Many even believed altcoins were created mainly to accumulate more BTC. Today this logic still works: liquidity

image
Plugin subscription started
Ideas_XAUUSD
Ideas_XAUUSD
4 Plugin subscription started ยทPlugin subscription started

XAU/USD | CPI incoming (READ THE CAPTION)
As you can see in the 4H chart of Gold, it is consolidating between the Bearish OB and the 4H FVG, mostly because it is waiting for CPI to make a move.
There's a support level at 4317 to monitor, and there's a Buyside liquidity below 4306 and another one below 4300.
Monitor these zones and make sure NOT to set an order for CPI news, cause it will without a doubt hurt you.
Hope you have a good day folks.

image
Plugin subscription started
Showing 58 out of 275
  • 54
  • 55
  • 56
  • 57
  • 58
  • 59
  • 60
  • 61
  • 62
  • 63
  • 64
  • 65
  • 66
  • 67
  • 68
  • 69
  • 70
  • 71
  • 72
  • 73

Plugin subscription started

Plugin subscription started


Plugin subscription started
Plugin subscription started /home/xtreders.com/public_html/themes/wondertag/layout/modals/site-alerts.phtml on line 208

Warning: Trying to access array offset on value of type null in /home/xtreders.com/public_html/themes/wondertag/layout/modals/site-alerts.phtml on line 208
https://xtreders.com/setting&user=&page=monetization">Plugin subscription started

Plugin subscription started

Plugin subscription started

Plugin subscription started

Plugin subscription started