Xtreders Xtreders
    #priceaction #tradingview #kabhi_ta_trading #technicalanalysis #btcusdt
    Advanced Search
  • Login
  • Register

  • Night mode

    Select Language

  • Arabic
  • Bengali
  • Chinese
  • Croatian
  • Danish
  • Dutch
  • English
  • Event_api_key_regenerated
  • Event_api_limit_reached
  • Event_plugin_disabled
  • Event_plugin_enabled
  • Event_plugin_subscription_expired
  • Event_plugin_subscription_renewed
  • Event_plugin_subscription_started
  • Event_test
  • Filipino
  • French
  • German
  • Hebrew
  • Hindi
  • Indonesian
  • Italian
  • Japanese
  • Korean
  • Persian
  • Portuguese
  • Russian
  • Spanish
  • Swedish
  • Turkish
  • Urdu
  • Vietnamese

Watch

Watch Reels

Events

Browse Events My events

Blog

Browse articles

Pages

My Pages Liked Pages

More

Forum Explore Popular Posts Fundings
Reels
Watch
Events
Blog
My Pages
See all

Discover posts

Posts

Users

Pages

Group

Blog

Events

Forum

Fundings

ideas_EURUSD
ideas_EURUSD
2 w ยทTranslate

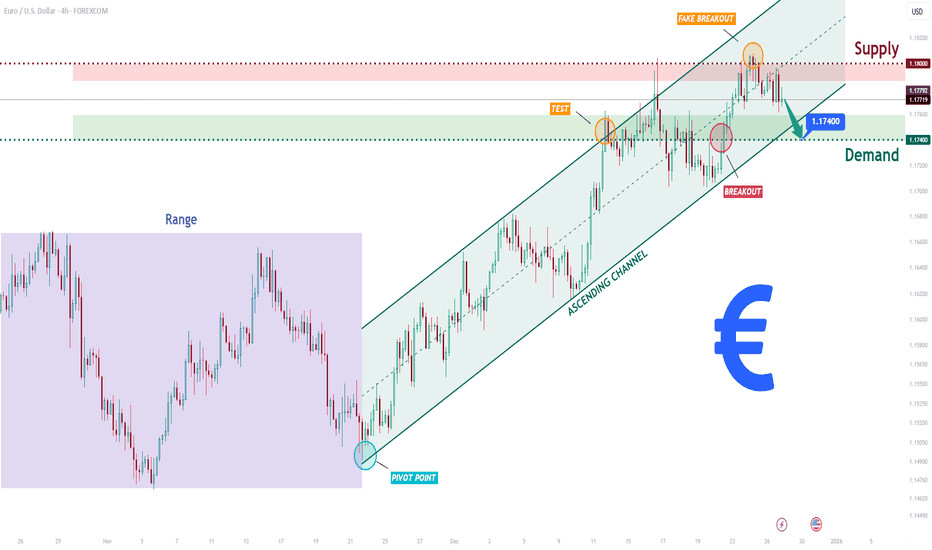
EURUSD Short: Failed Break 1.1800 - Demand at 1.1740 as Target
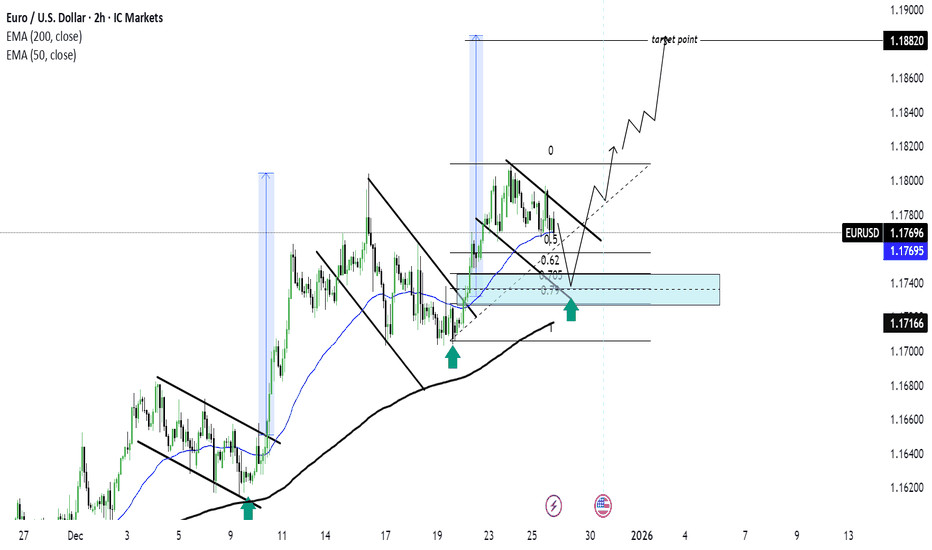
Hello traders! Heres a clear technical breakdown of EURUSD (4H) based on the current chart structure. After a prolonged consolidation phase marked by a broad range, EURUSD formed a clear pivot low and transitioned into a bullish recovery. From that pivot point, price established a well-defined ascending channel, confirming a shift in market structure and sustained buyer control through higher highs and higher lows.
Currently, price is trading below a key Supply Zone near 1.1800, where a fake breakout occurred, indicating strong selling pressure at the highs. This rejection from supply suggests that buyers struggled to gain acceptance above resistance. Following the rejection, price broke below short-term structure and is now pulling back toward the 1.1740 Demand Zone, which aligns with prior breakout structure and the lower boundary of the ascending channel.
My scenario:as long as EURUSD remains below the 1.1800 Supply Zone, the risk of a bearish reaction stays elevated. A clear rejection from this resistance area, especially with bearish confirmation, would favor short positions, targeting a move back toward the 1.1740 Demand Zone as the first objective. Manage your risk!

image
Like
Comment
Share
ideas_BTCUSDT
ideas_BTCUSDT
2 w ยทTranslate

Bitcoin - Can we hit the target at $91.000
This BTC technical analysis shows that Bitcoin is currently in a waiting phase. Price is trading around $87,500 and continues to move within a clearly defined range. Although a recent bounce has occurred, there is still a lack of a convincing impulse to define the next larger move. As a result, liquidity and fair value gaps remain the primary guiding factors.
4h bullish FVG
Within the bullish 4-hour FVG, a significant amount of liquidity is still present. This makes the zone around $86,000 to $86,500 an interesting area for a potential retest. As long as this liquidity has not been fully collected, there remains a strong possibility that BTC revisits this region. A deeper test of this FVG could actually provide a stronger foundation for a subsequent upward move.
4h bearish FVG
On the upside, the 4-hour bearish FVG forms a clear and strong resistance. This zone around $91,000 to $92,000 serves as the first logical target for a bounce originating from the lower range. There is substantial supply and prior rejection in this area, making a reaction highly likely. Only a convincing breakout would allow Bitcoin to shift focus toward higher price levels.
FInal thoughts
In summary, Bitcoin remains technically neutral to slightly bullish as long as the bullish 4-hour FVG continues to hold. The market appears to be gathering liquidity before committing to a direction. This BTC technical analysis emphasizes that patience is essential, as it first needs to become clear whether BTC will collect liquidity on the downside or move directly toward the bearish FVG for another test.

image
Like
Comment
Share
Ideas_XAUUSD
Ideas_XAUUSD
2 w ยทTranslate

Gold Preparing for Impulsive Move After Range Hold
Market Structure: Strong higher highs & higher lows bullish trend intact.
Price Action: Gold is compressing just below key resistance, indicating breakout pressure.
Liquidity: Equal highs liquidity resting above likely stop-hunt continuation.
Channel: Price respecting the ascending channel, no bearish deviation yet.
Ichimoku: Price holding above the cloud bullish momentum supported.
Bias: Bullish Continuation
Trade Idea:
Buy zone: Break & retest of resistance or shallow pullback inside channel
Invalidation: Clean close below channel support / cloud
Targets:
TP1: 4,557
TP2: 4,587

image
Like
Comment
Share
fxstreetforex
fxstreetforex
2 w ยทTranslate

GBP/USD gathers strength above 1.3450 on Fed rate cut bets, BoE's gradual policy pathThe GBP/USD pair gathers strength to around 1.3480 during the early Asian session on Friday. Expectations of the US Federal Reserve (Fed) rate cuts this year weigh on the US Dollar (USD) against the Pound Sterling (GBP). Philadelphia Fed President Anna Paulson is set to speak later on the

image
Like
Comment
Share
ideas_EURUSD
ideas_EURUSD
2 w ยทTranslate

EURUSD Pullback Toward 1.17500 Keeps Bullish Structure Intact
Hey Traders,
In todays trading session, we are monitoring EURUSD for a potential buying opportunity around the 1.17500 zone.
The pair remains in a well-defined uptrend and is currently undergoing a healthy corrective move. Price is approaching the 1.17500 area, a key zone of confluence where trend support aligns with a former support/resistance level. This area has previously attracted strong participation, making it technically significant.
As long as this level holds, the broader bullish structure remains intact, and a positive reaction here could support a continuation toward recent highs.
don't forget to support us with boost and leave your opinion on the comment section!
Trade safe,
Joe

image
Like
Comment
Share
ideas_BTCUSDT
ideas_BTCUSDT
2 w ยทTranslate

Risk Management: The Art of Long-Term Survival
Risk Management
Imagine a hero standing at a crossroads with three paths.
If he takes the road to the right, he will face a serious challenge with a difficulty level of 100. At the end of this path, however, he will be rewarded with five gold bars.
The middle road leads to ten gold bars, but the hero will encounter not one, but three challenges along the way. Each of them is no less difficult than the one on the right-hand road. Taken together, their total difficulty amounts to 300.
The left road involves a less demanding challenge with a difficulty of 60, but the reward is modest only one gold bar.
Which path would you choose if you were in the heros place?
Now suppose the hero chose a balanced level of risk, but along the way he was bitten by a snake and never even reached the challenge.
This is exactly what risk-taking in financial markets looks like.
In the real world, risk is first and foremost the probability of loss.
Risk is an inevitable consequence of the fact that the future is unknown. At any given moment, there are far more possible outcomes than those that ultimately materialize. It is precisely this gap between the range of potential outcomes and the single realized result that gives rise to risk. The future cannot be viewed as a predetermined or predictable script; it is a spectrum of possibilities that includes both favorable and unfavorable outcomes.
An investor may estimate the range of the most likely scenarios and base their expectations of the future on them. However, even the most probable event offers no guarantee that it will actually occur.
Risk comes in many forms, and the probability of loss is only one of them. Another important type is the risk of missed opportunities the risk of taking too little risk. Stayin

image
Like
Comment
Share
Ideas_XAUUSD
Ideas_XAUUSD
2 w ยทTranslate

XAUUSD Bullish Continuation Setup (30M)
Buy Zone: 4,520 4,530
Stop Loss:Below 4,500
Targets
TP1: 4,550
TP2: 4,600 4,610
Price is holding above ascending trendline and key demand. Bullish structure remains intact. A clean break and hold above resistance can trigger continuation toward the upper target zone.

image
Like
Comment
Share
fxstreetforex
fxstreetforex
2 w ยทTranslate

Gold Price Forecast: XAU/USD climbs to near $4,350 on Fed rate cut bets, geopolitical risks Gold price (XAU/USD) rises to near $4,345 during the early Asian session on Friday. Gold finished2025with a significant rally, achieving an annual gain of around65%, its biggest annual gain since

image
Like
Comment
Share
ideas_EURUSD
ideas_EURUSD
2 w ยทTranslate

EUR/USD) Bullish trend analysis Read The caption
SMC Trading point update
Technical analysis of EURUSD 2H chart using SMC + Fibonacci OTE + EMA trend continuation.

Market Context
Bias: Bullish continuation
Overall structure shows higher highs & higher lows
Strong impulsive move followed by healthy corrective channels
Price is holding above EMA 200, confirming HTF bullish bias
EMA 50 is acting as dynamic intraday support

What Price Is Doing
After a strong bullish displacement, price entered a descending corrective channel
That channel has now broken to the upside (bullish BOS)
Current pullback is a retest / re-accumulation, not weakness
This is classic trend correction continuation behavior.

Key Buy Zone (Blue Area)
~1.1735 1.1750
Why this zone is high-probability:
SMC demand / order block
Fib OTE zone (0.705 0.79)
EMA 50 + EMA 200 confluence
Previous resistance support flip
Multiple reactions already marked (green arrows)
This zone represents institutional rebalance, not retail buying.

Fibonacci Logic
Measured from the latest impulse low swing high:
0.5 / 0.62 = shallow pullback
0.705 0.79 = optimal trade entry (OTE)
Textbook continuation location in a bullish market

Trade Idea (Continuation Long)
Buy on confirmation inside demand
Entry: 1.1735 1.1750
Stop Loss: Below demand (~1.171
Targets:
TP1: 1.1780 (recent high)
TP2: 1.1820
Final TP: 1.1880 1.1890 (marked target point / liquidity above highs)
RiskReward: ~1:3+

Confirmation Triggers (Important)
Only take the trade if you see:
Bullish engulfing or strong rejection wick from the zone
Lower-timeframe CHoCH
Failure to accept below the OTE zone
Momentum

image
Like
Comment
Share
ideas_BTCUSDT
ideas_BTCUSDT
2 w ยทTranslate

Bitcoin The Big Liquidity Hunt is Coming!
Bitcoin's price is controlled by banks and governments. They won't allow the price to move until they have acquired the liquidity they need.
Before trading, you should always think about where most retail traders have placed their stop losses. They don't care if you lose; they're after liquidity.
But if you can identify these liquidity pools, you can ride along with the big banks and institutions and profit.
If technical analysis accounts for 20%, psychology is 80% of the story.
The timeframe for this analysis is 4 hours
On the chart, we've marked liquidity pools places where most traders have set their stops with $$$ signs.
The price has been ranging in this zone for 36 days. What happens each time? Liquidity pools form, these pools get swept, and then the price moves.
Now, the liquidity pools we've marked at the lows in red have not yet been swept, and most traders in long positions have their stops just below these two lows. The range from 83,764 to 82,412 is exactly where long traders stop losses will be hit, short positions will increase in size, and it is the best zone for a trend reversal.
There are many traders with a bearish view on Bitcoin but guess what happens if these two lows are hit? Longs get stopped out, traders in short positions either add to their size or new shorts join inand that is exactly where the price will bounce back upwards.
Trading is not hard or complicated if you have a professional coach.
If you have a coin or altcoin you want analyzed, first hit the like button and then comment its name so I can review it for you.
This is not a trade setup, as it has no precise stop-loss, stop, or target. I do not publish my trade setups here.

image
Like
Comment
Share
Showing 45 out of 279
  • 41
  • 42
  • 43
  • 44
  • 45
  • 46
  • 47
  • 48
  • 49
  • 50
  • 51
  • 52
  • 53
  • 54
  • 55
  • 56
  • 57
  • 58
  • 59
  • 60

Edit Offer

Add tier


Select an image
Delete your tier
Are you sure you want to delete this tier?
In order to sell your content and posts, start by creating a few packages. /home/xtreders.com/public_html/themes/wondertag/layout/modals/site-alerts.phtml on line 208

Warning: Trying to access array offset on value of type null in /home/xtreders.com/public_html/themes/wondertag/layout/modals/site-alerts.phtml on line 208
https://xtreders.com/setting&user=&page=monetization">Monetization

Pay By Wallet

Payment Alert

You are about to purchase the items, do you want to proceed?

Request a Refund