Xtreders Xtreders
    #priceaction #kabhi_ta_trading #tradingview #supportresistance #cryptotrading
    Plugin enabled
  • Plugin enabled
  • Plugin enabled

  • Plugin enabled

    Plugin enabled Plugin enabled

  • Arabic
  • Bengali
  • Chinese
  • Croatian
  • Danish
  • Dutch
  • English
  • Event_api_key_regenerated
  • Event_api_limit_reached
  • Event_plugin_disabled
  • Event_plugin_enabled
  • Event_plugin_subscription_expired
  • Event_plugin_subscription_renewed
  • Event_plugin_subscription_started
  • Event_test
  • Filipino
  • French
  • German
  • Hebrew
  • Hindi
  • Indonesian
  • Italian
  • Japanese
  • Korean
  • Persian
  • Portuguese
  • Russian
  • Spanish
  • Swedish
  • Turkish
  • Urdu
  • Vietnamese

Plugin enabled

Plugin enabled Plugin enabled

Plugin enabled

Plugin enabled Plugin enabled

Plugin enabled

Plugin enabled

Plugin enabled

Plugin enabled Plugin enabled

Plugin enabled

Plugin enabled Plugin enabled Plugin enabled Plugin enabled
Plugin enabled
Plugin enabled
Plugin enabled
Plugin enabled
Plugin enabled
Plugin enabled

Plugin enabled Plugin enabled

Posts

Plugin enabled

Plugin enabled

Plugin enabled

Plugin enabled

Plugin enabled

Plugin enabled

Plugin enabled

ideas_EURUSD
ideas_EURUSD
1 Plugin enabled ยทPlugin enabled

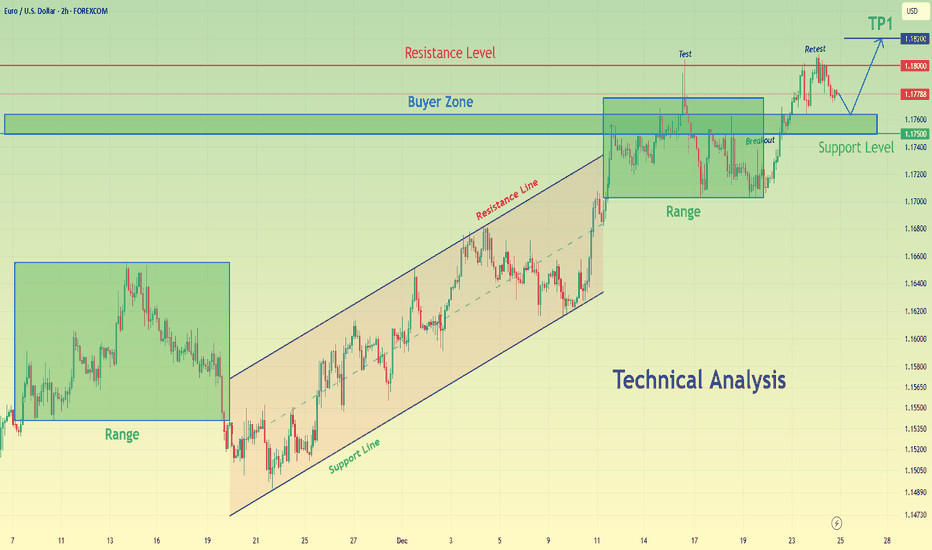
EURUSD in Uptrend Retest of Support Before Next Push
Hello traders! Heres my technical outlook on EURUSD (2H) based on the current chart structure. EURUSD is trading within a clear bullish environment after transitioning from a prolonged consolidation phase into an impulsive upward move. Earlier on the chart, price was moving inside a range, indicating balance between buyers and sellers. This range was eventually resolved to the upside, confirming a shift in market control. Currently, price is trading above the Support Level around the 1.1750 area, which also aligns with the Buyer Zone and the former range high. This zone is acting as a key demand area after the breakout. The recent pullback appears corrective, with price retesting support rather than showing impulsive selling pressure. As long as EURUSD holds above this support zone, the bullish structure remains intact. My scenario: if buyers continue to defend the 1.1750 Buyer Zone, EURUSD could resume its upward move toward the 1.1800 Resistance Level and potentially extend toward the 1.1820 TP1. A clean continuation above resistance would confirm further upside momentum. However, a breakdown below the support zone would signal a deeper correction and weaken the bullish setup. For now, the structure favors buyers while price respects support. Please share this idea with your friends and click Boost

image
Plugin enabled
Plugin enabled
Plugin enabled
ideas_BTCUSDT
ideas_BTCUSDT
1 Plugin enabled ยทPlugin enabled

BTC/USDT: Compression Phase Inside a Broad Structure
Hi!
Market Structure:
Bitcoin is currently trading inside a well-defined symmetrical triangle, characterized by a series of lower highs and higher lows. This structure reflects price compression and balance, not trend continuation.
Key Boundaries:
Price continues to respect both the descending upper boundary and the ascending lower boundary, confirming the validity of the pattern. No directional breakout has occurred yet.
Price Behavior:
Recent moves remain corrective, with repeated rejections from the upper boundary near 88.3k88.5k, while buyers defend the rising support around 87k86.8k.
Scenarios:
Bullish: A confirmed breakout and acceptance above the upper boundary would favor upside expansion.
Bearish: Rejection and loss of the lower boundary would shift momentum to the downside.

image
Plugin enabled
Plugin enabled
Plugin enabled
Ideas_XAUUSD
Ideas_XAUUSD
1 Plugin enabled ยทPlugin enabled

XAUUSD
Hello Traders!
What are your thoughts on Gold?
Gold entered a corrective phase after reaching the upper boundary of the ascending channel. This correction extended toward the lower boundary of the channel and the marked support zone, where price showed a strong bullish reaction. The subsequent rebound confirms that the overall bullish market structure remains intact.
At the moment, the highlighted resistance zone is acting as the main barrier to further upside.
If this resistance is broken decisively, continuation toward higher price levels can be expected.
Trading Plan:
For long positions, the preferred scenario is to wait for a clear breakout above the resistance and then enter on a pullback after price successfully holds above the broken level. This approach provides a more favorable risk-to-reward setup.
Invalidation:
If price breaks the lower boundary of the ascending channel and decisively moves below the support zone, the current bullish outlook will be invalidated.
Please Dont forget to like and share your thoughts in the comments!

image
Plugin enabled
Plugin enabled
Plugin enabled
fxstreetforex
fxstreetforex
1 Plugin enabled ยทPlugin enabled

This media is not supported in your browser VIEW IN TELEGRAM
Happy New Year, FXStreet traders and future traders!Heres to better analysis, sharper decisions, and profitable trades in 2026.

image
Plugin enabled
Plugin enabled
Plugin enabled
ideas_EURUSD
ideas_EURUSD
1 Plugin enabled ยทPlugin enabled

Hellena | EUR/USD (4H): SHORT to support area 1.16780 (Wave 2).
Colleagues, I believe that the price is completing an upward movement in wave 1 of the middle order, and we will soon see a correction in wave 2.
First of all, I think we should expect the completion of the small wave 5 in the 1.18300 area and then expect the price to fall to the support area of 1.16780.
There are two possible ways to reach the target:
1) the price will immediately start moving towards the target, and then we will need to slightly revise the wave marking.
2) from the resistance area.
In any case, the target is the same.
Manage your capital correctly and competently! Only enter trades based on reliable patterns!

image
Plugin enabled
Plugin enabled
Plugin enabled
ideas_BTCUSDT
ideas_BTCUSDT
1 Plugin enabled ยทPlugin enabled

Bitcoin Christmas Rally? $90K/More in Sight
Bitcoin ( BINANCE:BTCUSDT ), as I previously expected , has risen to its initial target and has broken above the important level of $88,200, which is a positive sign for continued bullish momentum.
At the moment, Bitcoin is striving to break through the resistance zone($89,230-$87,72.
From an Elliott Wave perspective, it seems that Bitcoin is completing microwave B of the main wave Y.
I expect that after breaking the resistance zone($89,230-$87,72, Bitcoin could rise at least up to the significant level of $90,300, approaching the Cumulative Short Liquidation Leverage and the 50_SMA(Daily). If BTC breaks above the 50_SMA(Daily), we can anticipate even further gains for Bitcoin.
The question is: do you think Bitcoin will hold above $90,000, or will it begin to decline again?
And finally, a little note about Christmas: I hope you enjoy a wonderful holiday season with your loved ones, and lets see how Bitcoin performs as we head into the new year!
Cumulative Long Liquidation Leverage: $86,690-$85,990
First Target: $90,161
Second Target: $90,721
Third Target: 50_SMA(Daily)
Stop Loss(SL): $86,850
Points may shift as the market evolves
Please respect each other's opinions and express agreement or disagreement politely.
Bitcoin Analysis (BTCUSDT), 1-hour time frame.
Always set a Stop Loss(SL) for every position you open.
This is just my idea; Id love to see your thoughts too!
If you find it helpful, please BOOST this post and share it with your friends.

image
Plugin enabled
Plugin enabled
Plugin enabled
Ideas_XAUUSD
Ideas_XAUUSD
1 Plugin enabled ยทPlugin enabled

XAUUSD Bullish Continuation
Gold is trading in a bullish structure after filling the previous gap. Price is holding above the key support zone around 45304509, indicating strong buying interest. A minor pullback toward support is possible, but as long as this area holds, bullish continuation is expected. The upside targets remain 4560 and 4590, where price may face resistance. A deeper drop toward 44854450 would act as major support and potential reversal zone. Overall bias stays bullish above support.

image
Plugin enabled
Plugin enabled
Plugin enabled
fxstreetforex
fxstreetforex
1 Plugin enabled ยทPlugin enabled

SoftBank group corp testing the breakouts resolve after parabolic surgeSoftBank Group Corp (SFTBF) just delivered one of those chart patterns that makes even experienced analysts do a

image
Plugin enabled
Plugin enabled
Plugin enabled
ideas_EURUSD
ideas_EURUSD
1 Plugin enabled ยทPlugin enabled

Holding Firm at Higher Levels, H4 Structure Remains Intact
Hello everyone,
On the H4 chart, EURUSD has delivered a clear expansion from the 1.155 area up toward 1.180. After this advance, price did not reverse sharply lower but instead shifted into a sideways consolidation, holding above the key EMA levels. This behavior suggests that current selling pressure is not strong enough to disrupt the short-term bullish structure.
During this consolidation phase, there are no signs of a structural breakdown or meaningful distribution. Pullbacks have been orderly, with narrow ranges and quick absorption, indicating that buyers are still holding positions rather than actively exiting the market.
Overall, the current price action looks more like post-rally consolidation than a weak rebound within a downtrend. As long as price remains above the EMAs, the H4 uptrend is preserved, while the market likely needs more time to rebalance supply and demand before defining its next directional move.
Wishing you all effective and successful trading!

image
Plugin enabled
Plugin enabled
Plugin enabled
ideas_BTCUSDT
ideas_BTCUSDT
1 Plugin enabled ยทPlugin enabled

BTCUSDT Long: Buyers Defend Channel Support, Upside in Focus
Hello traders! Heres a clear technical breakdown of BTCUSDT (4H) based on the current chart structure. After a prolonged consolidation phase defined by a broad range, BTC established multiple internal breakouts, highlighting volatility but no clear directional dominance. This range acted as an accumulation zone, with price repeatedly reacting around key horizontal levels. From the lower boundary of the range, BTC formed a clear pivot low, which marked the start of a bullish recovery and shift in short-term market structure.
Currently, BTC is holding above the Demand Zone around 86,800, which aligns with prior range support and the lower boundary of the ascending channel. This area has already shown buyer reaction, reinforcing it as a key level for continuation. Price is now attempting to push higher toward the upper boundary of the channel.
My scenario: as long as BTCUSDT holds above the Demand Zone and respects the ascending channel support, the bias remains bullish. I expect buyers to defend this area and attempt a move back toward the 89,000 Supply/Resistance Zone as the first target. A clean breakout and acceptance above this level would confirm bullish continuation and open the path toward higher targets within the channel. A breakdown below demand would invalidate the long scenario. Manage your risk!

image
Plugin enabled
Plugin enabled
Plugin enabled
Showing 44 out of 275
  • 40
  • 41
  • 42
  • 43
  • 44
  • 45
  • 46
  • 47
  • 48
  • 49
  • 50
  • 51
  • 52
  • 53
  • 54
  • 55
  • 56
  • 57
  • 58
  • 59

Plugin enabled

Plugin enabled


Plugin enabled
Plugin enabled
Plugin enabled
Plugin enabled /home/xtreders.com/public_html/themes/wondertag/layout/modals/site-alerts.phtml on line 208

Warning: Trying to access array offset on value of type null in /home/xtreders.com/public_html/themes/wondertag/layout/modals/site-alerts.phtml on line 208
https://xtreders.com/setting&user=&page=monetization">Plugin enabled

Plugin enabled

Plugin enabled

Plugin enabled

Plugin enabled