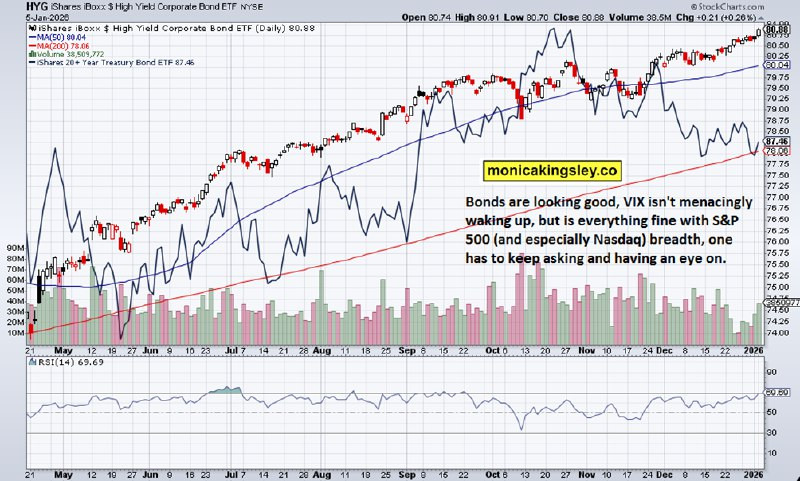
EUR/USD 1D CHART PATTERN
The EUR/USD daily chart shows price reacting strongly from a well-defined resistance zone, marked by multiple rejections in the highlighted supply area. These repeated failures to break higher suggest weakening bullish momentum and increasing selling pressure. Price has recently broken below the rising trendline that was supporting the previous upward structure, indicating a possible trend shift or deeper correction. The Ichimoku cloud reflects market indecision, with price hovering near the cloud and struggling to regain strong bullish control. This structure favors a cautious bearish outlook while below resistance. A sustained move downward could open the path toward the first support zone near 1.16744. If bearish momentum continues and sellers remain in control, the second downside objective around 1.15980 becomes likely. Risk management remains essential.
If you found this XAUUSD analysis helpful, dont forget to LIKE and COMMENT !
XAU/USD Strength Builds After Trendline Break, Bulls Eye Higher
The XAU/USD 45-minute chart shows a clear shift from bearish pressure to emerging bullish momentum. Price previously respected a descending trendline and formed a strong base near the lower demand zone, where buyers stepped in aggressively. After multiple rejections from the lows, gold broke above short-term resistance and is now consolidating above the highlighted support area, indicating healthy accumulation. The Ichimoku structure reflects improving conditions as price holds above the cloud, signaling trend reversal strength. The recent pullback appears corrective rather than impulsive, keeping the bullish structure intact. As long as price remains above the support zone, further upside is favored. A continuation move is expected toward the first target at 4472, followed by an extension toward the second target at 4500, aligning with projected bullish expansion.
If you found this XAUUSD analysis helpful, dont forget to LIKE and COMMENT !
Inflation it killsGood Day... and a Tom Terrific Tuesday to you! Well, my first day down here in S Florida was good. I went out to the deck by the ocean and read for a couple of hours, soaking up some vitamin D... I got my TV to connect to the internet, so now I'm able to stream, but my laptop is
Gold Outlook Demand Holding, Upside Projected
Gold forming a classic inverse head and shoulders structure after a sharp bearish impulse. Price established the left shoulder, head, and right shoulder within a clearly defined accumulation base, signaling exhaustion of selling pressure. The neckline is marked around the 4,403 region, and price has reacted strongly from the highlighted buy zone, confirming demand interest. The projected bullish continuation targets the 4,538 resistance/high, aligning with the measured move of the pattern. Overall, the structure suggests a short-term bullish reversal, contingent on sustained acceptance above the neckline.
Canadian Dollar softens amid subdued Oil prices and a firm US DollarThe Canadian Dollar (CAD) softens against the US Dollar (USD) on Tuesday, with USD/CAD holding an upward bias as the Greenback holds firm despite cautious Federal Reserve (Fed) commentary and softer US S&P Global Purchasing Managers Index (PMI)
GOLD (XAUUSD) Buy From Support | Targets 4,452 4,600
Gold is currently holding above a strong demand zone after a healthy pullback within a bullish market structure. Price has respected this support multiple times, suggesting seller weakness and potential absorption.
A move toward the resistance area around 4,452 is expected.
If price breaks and holds above resistance, bullish continuation toward 4,600 becomes likely.
As long as price remains above the support zone, the bullish bias stays valid.
A break below 4,187 invalidates this setup.
NZD/USD pulls back below 0.5800 as markets turn cautiousThe New Zealand Dollars rebound from the 0.5740 area on Monday has failed to find follow-through above the 0.5800 level during Tuesdays European session, and the pair pulled back to the 0.5790 area, heading into the US session opening.The risk-on mood seen on Mondays US trading session and