Xtreders Xtreders
    #priceaction #kabhi_ta_trading #tradingview #supportresistance #cryptotrading
    Advanced Search
  • Login
  • Register

  • Night mode

    Select Language

  • Arabic
  • Bengali
  • Chinese
  • Croatian
  • Danish
  • Dutch
  • English
  • Event_api_key_regenerated
  • Event_api_limit_reached
  • Event_plugin_disabled
  • Event_plugin_enabled
  • Event_plugin_subscription_expired
  • Event_plugin_subscription_renewed
  • Event_plugin_subscription_started
  • Event_test
  • Filipino
  • French
  • German
  • Hebrew
  • Hindi
  • Indonesian
  • Italian
  • Japanese
  • Korean
  • Persian
  • Portuguese
  • Russian
  • Spanish
  • Swedish
  • Turkish
  • Urdu
  • Vietnamese

Watch

Watch Reels

Events

Browse Events My events

Blog

Browse articles

Pages

My Pages Liked Pages

More

Forum Explore Popular Posts Fundings
Reels
Watch
Events
Blog
My Pages
See all

Discover posts

Posts

Users

Pages

Group

Blog

Events

Forum

Fundings

Ideas_XAUUSD
Ideas_XAUUSD
1 w ยทTranslate

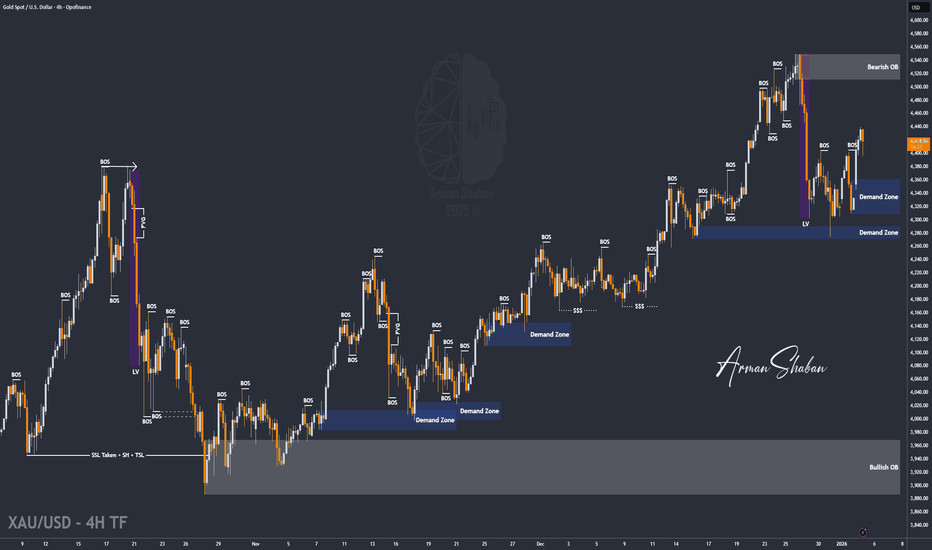
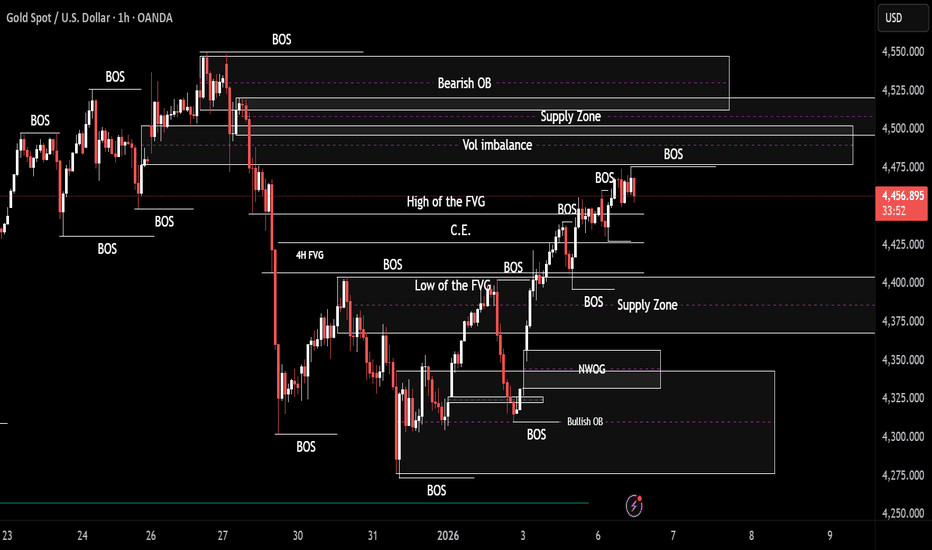
XAU/USD | Bullish Structure Remains Intact (READ THE CAPTION)
By analyzing the #gold chart on the 4-hour timeframe, we can see that price first made a clean pullback to $4274, then strong demand stepped in and pushed gold sharply higher to $4440. After reaching this key psychological resistance, price corrected and is now trading around $4414.
If gold can close and hold above $4404, we can expect further upside. That said, a short-term pullback toward the $4334$4346 zone is still possible. With ongoing geopolitical risks, gold could even push toward levels above $4550 in the short term. Lets see how the market reacts next.
Please support me with your likes and comments to motivate me to share more analysis with you and share your opinion about the possible trend of this chart with me !
Best Regards , Arman Shaban

image
Like
Comment
Share
fxstreetforex
fxstreetforex
1 w ยทTranslate

Cutting through the noiseThe first full week of 2026 has become entirely engrossed by geopolitics, much of which seems very unlikely to have a material impact on FX markets over the long run. But it has still generated an enormous amount of noise, to the extent that almost everything else has become crowded

image
Like
Comment
Share
fxstreetforex
fxstreetforex
1 w ยทTranslate

AUD/USD Price Forecast: Overbought RSI flags pullback risk as uptrend holdsThe Australian Dollar (AUD) trades flat against the US Dollar (USD) on Wednesday, with AUD/USD easing back after an initial advance triggered by Australias latest inflation data. At the time of writing, the pair is trading around 0.6738, holding near 15-month

image
Like
Comment
Share
fxstreetforex
fxstreetforex
1 w ยทTranslate

Gold retraces from $4500, bulls in control above $4350Geo political tensions are causing global economic uncertainty as US attack on Venezuela has sparked safe haven demand resulting in Gold

image
Like
Comment
Share
fxstreetforex
fxstreetforex
1 w ยทTranslate

USD/JPY steady as mixed US data, BoJ hawkishness shape sentimentUSD/JPY trades around 156.60 on Wednesday at the time of writing, virtually unchanged on the day, as the US Dollar (USD) struggles to extend its rebound following mixed US economic releases, while the Japanese Yen (JPY) benefits from a more defensive tone in Asian

image
Like
Comment
Share
ideas_BTCUSDT
ideas_BTCUSDT
1 w ยทTranslate

BTC: The Premium Zone Trap (4H vs 1H)
Bitcoin is at a decisive junction. We are trading in the Premium Zone ($93,700+) with a clear conflict between timeframes. The 4H screams exhaustion (RSI 70.7 + Low Volume), while the 1H structure remains stubbornly bullish, holding above the $92,102 demand zone. The structure is intact, but the conviction is missing.
1. THE TECHNICAL REALITY (4H + 1H)
We are seeing a divergence between price action and momentum:
The Trap (4H): Price is in the Premium sell zone. RSI is overbought (70.7) and volume is down 41% at these highs. This is classic "divergence" behavior, price grinding up while participation drops.
The Floor (1H): Despite the macro exhaustion, the 1H timeframe has cooled off (RSI 42.9) and is respecting the Ascending Support Trendline ($92,306).
The Magnet: We have a bearish OB supply overhead at $94,760, but a juicy unfilled FVG sitting below at $90,189. Price hates leaving these gaps open.
2. THE CONFLICT: MOMENTUM VS. STRUCTURE
Bearish Case (The Exhaustion):
Volume has collapsed 66% on the 1H timeframe.
MACD is printing bearish divergence on the 4H.
14.1% wick rejection at the $94,760 local top suggests sellers are active.
Bullish Case (The Trend):
CHoCH and BOS are both confirmed bullish.
Price is holding above all major EMAs (20/50/20.
Buyers are defending the $92,102 Order Block.
3. THE TRADE SETUP
We play the reaction, not the prediction. Here are the two probability paths:
Scenario A: The Premium Rejection (Higher Probability) If volume fails to return, gravity takes over.
Trigger: Loss of the 1H support trendline ($92,30
Target 1: $90,189 (Filling the 4H FVG)
Target 2: $86,760 (Major Swing Low)
Invalidation: 4H Close above $94,760

image
Like
Comment
Share
fxstreetforex
fxstreetforex
1 w ยทTranslate

US Dollar stabilizes on mixed US data, Canadian Dollar weighed by Oil declineUSD/CAD trades around 1.3820 on Wednesday at the time of writing, up 0.10% on the day, supported by a modest rebound in the US Dollar (USD) amid mixed US economic data and persistent weakness in the Canadian Dollar

image
Like
Comment
Share
ideas_BTCUSDT
ideas_BTCUSDT
1 w ยทTranslate

Bitcoin - Soon pump to 98k! But sell here, because...
Bitcoin is temporarily bullish, and from a technical point of view, we can expect 98,439 USD in the short term. There are many reasons behind this movement, the first is that Bitcoin is forming a bigger bearish flag that is well visible on the daily chart. This is not the ultimate bottom on Bitcoin - I believe we are going to see levels around 60k later this year!
In the short term Bitcoin is forming an ascending parallel channel projection or a bearish flag, so if the price hits the upward trendline, that's a good time to open a short position or take profit on your long position. After that we can go all the way down to the bottom of the channel and test the upward-sloping trendline at around 89k. Why 60k later this year? Please look at my previous posts, because the fundamentals are extremely negative for Bitcoin. I think all ETFs' early investors will get liquidated! Also, bitcoin halving cycles are bearish this year.
So in short - take your profit below 98,439 USDT or open a short position below 98,439 USDT because this is a very significant level and point of interest.
Write a comment with your altcoin + hit the like button, and I will make an analysis for you in response. Thank you, and I wish you successful trades!

image
Like
Comment
Share
fxstreetforex
fxstreetforex
1 w ยทTranslate

Ready to trade Gold? Heres what you need to know! Gold is one of the most traded assets, but success comes down to knowing the key details and choosing the right broker.WeveIn our latest article: How to get started with Gold trading Leverage options and what they mean Gold CFDs explained - why they matterRead the full guide here: Weve ranked the top brokers for Gold so you can trade smarter, not harder!
Best Brokers for Gold Trading in 2026 - FXStreetReady to trade gold? Our complete guide reviews the best brokers for gold trading in 2026 and discuss their characteristics, platforms, and conditions.

image
Like
Comment
Share
Ideas_XAUUSD
Ideas_XAUUSD
1 w ยทTranslate

XAU/USD | Bullish momentum continues (READ THE CAPTION)
As you can see in the Hourly chart of Gold, the market opened at 4356 yesterday and then it went on a Bullish Move, reaching as high as 4475. That means in a matter of a single day, Gold moved more than 1000 pips!
Currently it is being traded at 4455, I can see it going going to the high of the FVG and then going upwards again.
Gold Targets for now: 4463, 4475, 4487 and 4500.
P.S: Be cautious with your trades and watch out for geo-politic events.

image
Like
Comment
Share
Showing 23 out of 274
  • 19
  • 20
  • 21
  • 22
  • 23
  • 24
  • 25
  • 26
  • 27
  • 28
  • 29
  • 30
  • 31
  • 32
  • 33
  • 34
  • 35
  • 36
  • 37
  • 38

Edit Offer

Add tier


Select an image
Delete your tier
Are you sure you want to delete this tier?
In order to sell your content and posts, start by creating a few packages. /home/xtreders.com/public_html/themes/wondertag/layout/modals/site-alerts.phtml on line 208

Warning: Trying to access array offset on value of type null in /home/xtreders.com/public_html/themes/wondertag/layout/modals/site-alerts.phtml on line 208
https://xtreders.com/setting&user=&page=monetization">Monetization

Pay By Wallet

Payment Alert

You are about to purchase the items, do you want to proceed?

Request a Refund