Xtreders Xtreders
    #priceaction #kabhi_ta_trading #tradingview #supportresistance #cryptotrading
    Plugin enabled
  • Plugin enabled
  • Plugin enabled

  • Plugin enabled

    Plugin enabled Plugin enabled

  • Arabic
  • Bengali
  • Chinese
  • Croatian
  • Danish
  • Dutch
  • English
  • Event_api_key_regenerated
  • Event_api_limit_reached
  • Event_plugin_disabled
  • Event_plugin_enabled
  • Event_plugin_subscription_expired
  • Event_plugin_subscription_renewed
  • Event_plugin_subscription_started
  • Event_test
  • Filipino
  • French
  • German
  • Hebrew
  • Hindi
  • Indonesian
  • Italian
  • Japanese
  • Korean
  • Persian
  • Portuguese
  • Russian
  • Spanish
  • Swedish
  • Turkish
  • Urdu
  • Vietnamese

Plugin enabled

Plugin enabled Plugin enabled

Plugin enabled

Plugin enabled Plugin enabled

Plugin enabled

Plugin enabled

Plugin enabled

Plugin enabled Plugin enabled

Plugin enabled

Plugin enabled Plugin enabled Plugin enabled Plugin enabled
Plugin enabled
Plugin enabled
Plugin enabled
Plugin enabled
Plugin enabled
Plugin enabled

Plugin enabled Plugin enabled

Posts

Plugin enabled

Plugin enabled

Plugin enabled

Plugin enabled

Plugin enabled

Plugin enabled

Plugin enabled

Ideas_XAUUSD
Ideas_XAUUSD
1 Plugin enabled ยทPlugin enabled

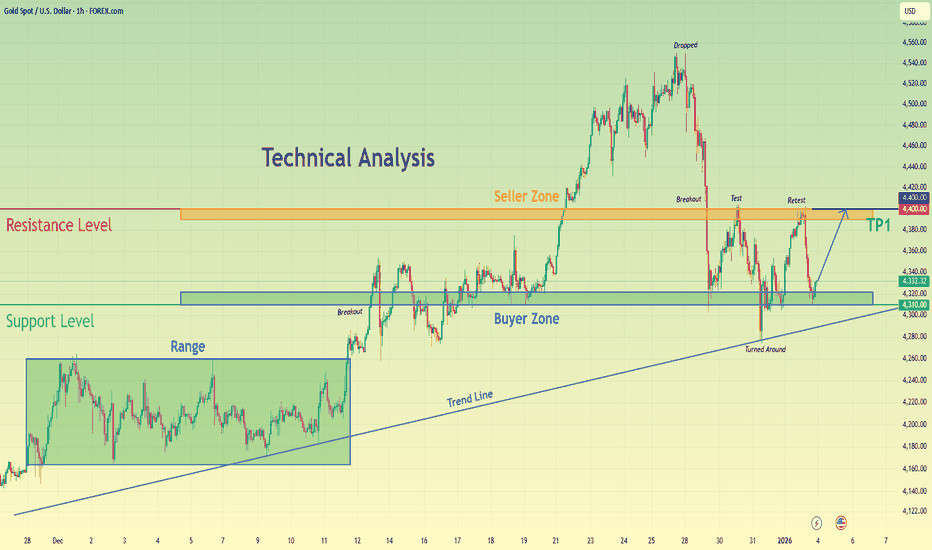
XAUUSD Buyers Step In at Key Level - Momentum Stabilizes
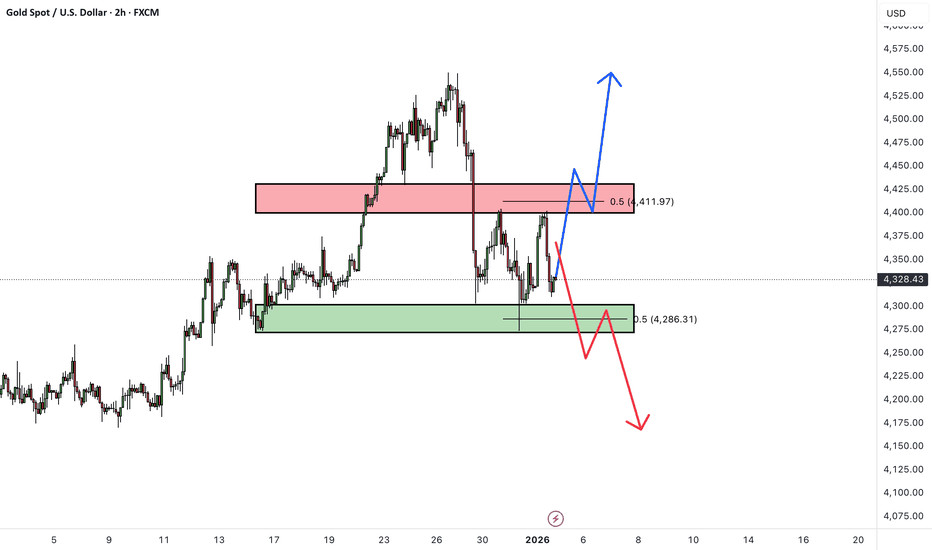
Hello traders! Heres my technical outlook on XAUUSD (1H) based on the current chart structure. Gold is trading within a broader bullish structure after a strong impulsive rally from lower levels. Earlier, price moved inside a consolidation range, signaling accumulation before breaking out to the upside and confirming renewed buyer control. This breakout initiated a sharp bullish leg, forming a sequence of higher highs and higher lows. Following the impulsive move, XAUUSD reached the Seller Zone around the 4,400 Resistance Level, where strong selling pressure appeared. Price dropped aggressively from this area, confirming supply dominance at higher levels. After the drop, gold broke below the resistance, then performed a test and retest of the same zone, which now acts as resistance. This behavior confirms a short-term structural shift while the broader bullish trend remains intact. Currently, price is reacting around the Buyer Zone near 4,3104,320, which aligns with a key Support Level and a previous breakout area. This zone has already shown a clear reaction, with price turning around and forming a higher low above the rising Trend Line. The recent move into support appears corrective rather than impulsive, suggesting a pause within the larger bullish structure rather than a full reversal. My scenario: as long as XAUUSD holds above the Buyer Zone and respects the rising Trend Line, the bullish structure remains valid. A strong reaction from this area could lead to a move back toward the 4,400 Resistance Level (TP1). A confirmed breakout and acceptance above resistance would signal bullish continuation. However, a decisive breakdown below the Buyer Zone would weaken the structure and signal a deeper corrective move. For now, price is at a key decision area, with b

image
Plugin enabled
Plugin enabled
Plugin enabled
fxstreetforex
fxstreetforex
1 Plugin enabled ยทPlugin enabled

GBP/USD reclaims 1.3500 as Dollar falters on geopolitical shock, weak US dataGBP/USD surges over 0.29% on Monday as the Greenback erases earlier gains sponsored by risk aversion in the FX space courtesy of geopolitical developments over the weekend. The pair trades at 1.3500 after bouncing off daily lows of

image
Plugin enabled
Plugin enabled
Plugin enabled
ideas_EURUSD
ideas_EURUSD
1 Plugin enabled ยทPlugin enabled

EURUSD Breakdown Confirmed, 1.1640 Support in Focus
Hello traders! Heres my technical outlook on EURUSD (2H) based on the current chart structure. EURUSD initially traded within a well-defined ascending channel, showing a strong bullish structure with higher highs and higher lows after the market started to grow from the lower levels. This bullish phase reflected steady buyer control, supported by a rising support line and multiple clean reactions along the channel structure. Eventually, price broke above the channel resistance, signaling momentum expansion. Following the breakout, EURUSD entered a clear range, where price consolidated between key highs and lows, indicating temporary balance between buyers and sellers. Multiple internal reactions and false moves within this range highlighted uncertainty and distribution near the highs. After topping out, price turned around and transitioned into a short-term descending channel, marking a shift in momentum. During this pullback, EURUSD broke below the range support and the descending channel support, confirming increasing bearish pressure. Price is now trading below the Resistance Level near 1.1720, which aligns with the former breakout area and the Seller Zone, reinforcing it as a strong supply region. The recent breakout below this level suggests sellers are gaining control in the short term. Currently, price is reacting around the Buyer Zone near the Support Level around 1.1670. This area aligns with prior demand and has already produced a small bounce, indicating potential short-term reaction. However, the overall structure remains corrective within the broader move. My scenario: as long as EURUSD remains below the 1.1720 Resistance Level, bearish pressure is likely to persist, with TP1 targeting the 1.1640 Support Level. A clear breakdown below support would open

image
Plugin enabled
Plugin enabled
Plugin enabled
ideas_BTCUSDT
ideas_BTCUSDT
1 Plugin enabled ยทPlugin enabled

Bitcoin Stuck in a Holiday Range CME Gap Below?
During the Christmas period, Bitcoin ( BINANCE:BTCUSDT ) didnt exhibit strong momentum and has been moving within a range.
Bitcoin is currently near the resistance zone($90,960-$90,09 and the Cumulative Short Liquidation Leverage($91,840-$90,92.
From an Elliott Wave perspective, it appears that Bitcoin has completed the Double Three Correction(WXY).
I expect that given the weekend and generally lower trading volume at this time, Bitcoin may struggle to break the resistance zone($90,960-$90,09 and could begin to decline, potentially filling the CME Gap($88,720-$88,12. If BTC breaks the support lines, we can expect further declines to the support zone($87,050-$86,42.
Note: Additionally, two important trading levels to watch for Bitcoin are $90,300 and $87,830.
What are your thoughts? Do you think Bitcoin will continue its trend into 2026, or should we prepare for a correction? Id love to hear your opinion!
Cumulative Long Liquidation Leverage: $87,110-$86,020
First Target: Support lines
Second Target: Support zone($87,050-$86,42
Stop Loss(SL): $91,880
Points may shift as the market evolves
Please respect each other's opinions and express agreement or disagreement politely.
Bitcoin Analysis (BTCUSDT), 1-hour time frame.
Always set a Stop Loss(SL) for every position you open.
This is just my idea; Id love to see your thoughts too!
If you find it helpful, please BOOST this post and share it with your friends.

image
Plugin enabled
Plugin enabled
Plugin enabled
Ideas_XAUUSD
Ideas_XAUUSD
1 Plugin enabled ยทPlugin enabled

GOLD Weekly Levels: Buy/Hold 4270/4300 Target 4500/4633
GOLD WEEKLY SNAPSHOT EXECUTIVE SUMMARY
Gold in wave-4 accumulation after extended impulse
Primary impulse complete: 3910 4500 (H2/H4)
Current pullback: 4500 4268 = corrective, not reversal
Accumulation zone: 43004268 (buy dips only)
Trend remains bullish while above 4210
Wave-5 target: 46304650 price discovery zone
Expect consolidation before expansion
Invalidation: acceptance below 4210
Strategy: buy & hold dips, dont chase highs
Final leg likely followed by larger consolidation
Gold Weekly Scenarios Whats Your Play?
Which path do you have for XAUUSD next week?
Hold 4,27x4,30x continuation toward 4,500+ / wave-5 extension
Dip into 4,25x4,26x, then rotate higher (accumulation before breakout)
Acceptance > 4,380 squeeze confirms upside continuation
Your level: drop one price youre watching most next week
GOLD WEEKLY SNAPSHOT BY PROJECTSYNDICATE
Swing High / Swing Low
$4,500 $4,268 controlled pullback from the wave-3 peak following an extended impulse. The decline into the $4,26x area shows overlap, compression, and reduced momentum, consistent with a wave-4 corrective phase rather than trend reversal. Weekly structure remains constructive while price holds above key invalidation.
Trend
Higher-timeframe:
Primary trend remains bullish following a completed 5-wave impulse on H2/H4, with wave-3 extension from $4,000 $4,500 confirming strong trend participation.
Tactical:
Current price action fits a wave-4 accumulation / consolidation phase:
Shallow pullback relative to wave-3
Overlapping ranges
Compression above prior breakout structure
As long as price holds above $4,210, the tape favors continua

image
Plugin enabled
Plugin enabled
Plugin enabled
fxstreetforex
fxstreetforex
1 Plugin enabled ยทPlugin enabled

FX Today: Gold surges past $4,400 as Venezuela crisis shakes financial marketsOver the weekend, the United States (US) military entered Venezuela, capturing and bringing Venezuelan President Nicols Maduro and his wife, Cilia Flores, to New

image
Plugin enabled
Plugin enabled
Plugin enabled
ideas_EURUSD
ideas_EURUSD
1 Plugin enabled ยทPlugin enabled

What to Expect this week for EURUSD
The price has been forming a clear Elliott Wave pattern to the upside since early November 2025. The first impulse wave retraced to the 78.6% level, followed by another bullish impulse that pulled back to the 38.2% level. A pullback to the 38.2% or 28.6% level typically indicates strong bullish momentum. As we observe the final impulse in the classic Elliott Wave structure, the price has now pulled back to the 50% level, a deeper correction than the previous 38.2%. This suggests the price may be starting to reverse. The key question is whether the price will break below the ascending trendline. I believe there is a strong possibility of this occurring. Lets review the economic calendar for this weeks upcoming risk events.
MAJOR RISK EVENTS TO WATCH OUT FOR THIS UPCOMING WEEK
Tuesday, Jan 6
* Germany CPI / HICP Flash (Dec) headline and harmonized inflation market-moving for EUR and ECB expectations. Scheduled for ~130 GMT.
Wednesday, Jan 7
* Eurozone CPI Flash (Dec) inflation for euro area (headline + core) ahead of ECB context.
* ADP Employment Change (Dec) private payrolls preview of Fridays jobs.
* ISM Services PMI (Dec) key for services-led U.S. economy.
Thursday, Jan 8
* Eurozone Unemployment Rate (Nov) growth/employment gauge for ECB outlook.
* Weekly Jobless Claims labor market breadth check.
* Trade Balance (Oct) net-exports impact on GDP narrative.
Friday, Jan 9
* Eurozone Retail Sales (Nov) consumer demand signal.
* U.S. Nonfarm Payrolls (Dec) the big one for USD volatility (jobs + wages + unemployment).
Key levels to watch
Upside: Analysts highlight 1.17601.1807 as immediate resistance; a firm break and hold above this zone opens room toward previous highs near 1.18

image
Plugin enabled
Plugin enabled
Plugin enabled
ideas_BTCUSDT
ideas_BTCUSDT
1 Plugin enabled ยทPlugin enabled

Bitcoin (BTC): 2026 Will Be Year Of Bear Market
So 2026 is here which means a fresh year of opportunities
That being said, I thought to make a very simple TA here of what 2026 might be giving us and what we are expecting to happen as well.
Basically, as price is hovering near the local neckline area just as last time when we were on the edge of a bullish market, the end of the year gave us one last push, similar to what we are expecting to see right now as well.
That being said, this is not the major move we are looking for in 2026; the major move is the break of that neckline, which would then give us a bigger downside movement (around 52%, like in 2022).
Swallow Academy

image
Plugin enabled
Plugin enabled
Plugin enabled
Ideas_XAUUSD
Ideas_XAUUSD
1 Plugin enabled ยทPlugin enabled

XAUUSD
Hello Traders!
What are your thoughts on GOLD?
After a strong bullish rally, Gold has entered a range-bound consolidation phase between clearly defined support and resistance zones.
At the moment, price is trading within the range, and positions taken in the middle of the range carry elevated risk, as price can reverse sharply from either side and trigger stop losses.
Trading Plan:
In the short term, the preferred strategy is to wait for a confirmed breakout from the range:
1Bullish scenario: A clean break above the resistance zone, followed by a pullback and continuation to the upside
2Bearish scenario: A confirmed breakdown below the support zone, followed by a pullback and continuation to the downside
Please Dont forget to like and share your thoughts in the comments!

image
Plugin enabled
Plugin enabled
Plugin enabled
fxstreetforex
fxstreetforex
1 Plugin enabled ยทPlugin enabled

USD/JPY falls amid weak US manufacturing data, rising Japanese yieldsUSD/JPY trades lower around 156.30 on Monday at the time of writing, down 0.40% on the day, after giving back part of its earlier

image
Plugin enabled
Plugin enabled
Plugin enabled
Showing 32 out of 274
  • 28
  • 29
  • 30
  • 31
  • 32
  • 33
  • 34
  • 35
  • 36
  • 37
  • 38
  • 39
  • 40
  • 41
  • 42
  • 43
  • 44
  • 45
  • 46
  • 47

Plugin enabled

Plugin enabled


Plugin enabled
Plugin enabled
Plugin enabled
Plugin enabled /home/xtreders.com/public_html/themes/wondertag/layout/modals/site-alerts.phtml on line 208

Warning: Trying to access array offset on value of type null in /home/xtreders.com/public_html/themes/wondertag/layout/modals/site-alerts.phtml on line 208
https://xtreders.com/setting&user=&page=monetization">Plugin enabled

Plugin enabled

Plugin enabled

Plugin enabled

Plugin enabled