Xtreders Xtreders
    #priceaction #kabhi_ta_trading #tradingview #supportresistance #cryptotrading
    Plugin enabled
  • Plugin enabled
  • Plugin enabled

  • Plugin enabled

    Plugin enabled Plugin enabled

  • Arabic
  • Bengali
  • Chinese
  • Croatian
  • Danish
  • Dutch
  • English
  • Event_api_key_regenerated
  • Event_api_limit_reached
  • Event_plugin_disabled
  • Event_plugin_enabled
  • Event_plugin_subscription_expired
  • Event_plugin_subscription_renewed
  • Event_plugin_subscription_started
  • Event_test
  • Filipino
  • French
  • German
  • Hebrew
  • Hindi
  • Indonesian
  • Italian
  • Japanese
  • Korean
  • Persian
  • Portuguese
  • Russian
  • Spanish
  • Swedish
  • Turkish
  • Urdu
  • Vietnamese

Plugin enabled

Plugin enabled Plugin enabled

Plugin enabled

Plugin enabled Plugin enabled

Plugin enabled

Plugin enabled

Plugin enabled

Plugin enabled Plugin enabled

Plugin enabled

Plugin enabled Plugin enabled Plugin enabled Plugin enabled
Plugin enabled
Plugin enabled
Plugin enabled
Plugin enabled
Plugin enabled
Plugin enabled

Plugin enabled Plugin enabled

Posts

Plugin enabled

Plugin enabled

Plugin enabled

Plugin enabled

Plugin enabled

Plugin enabled

Plugin enabled

ideas_BTCUSDT
ideas_BTCUSDT
1 Plugin enabled ยทPlugin enabled

BTCUSDT Long: Demand Support Intact, Next Test at $89,000
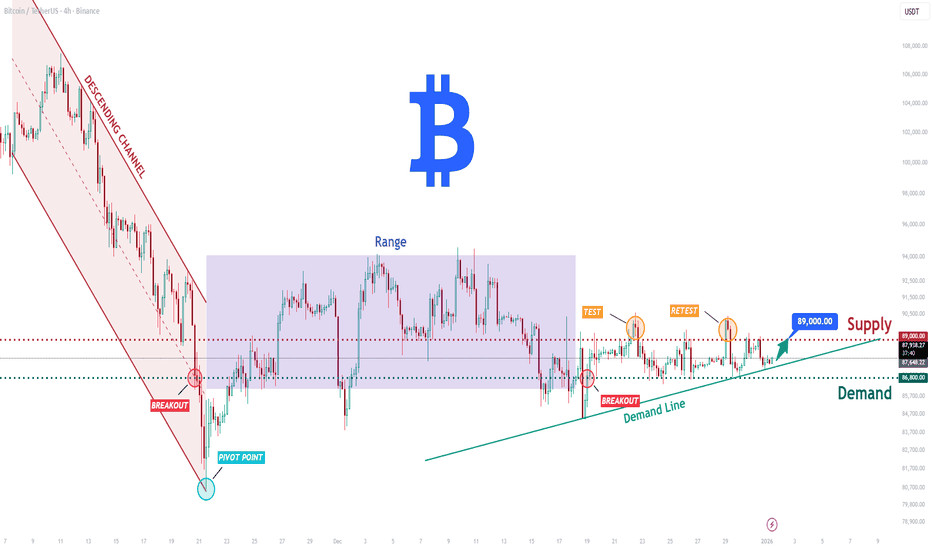
Hello traders! Heres a clear technical breakdown of BTCUSDT (4H) based on the current chart structure. After a strong bearish impulse, Bitcoin was trading inside a well-defined descending channel, reflecting sustained seller control. This bearish phase ended with a clear breakdown and a sharp reaction from a key pivot low, where buyers stepped in aggressively, marking an important structural shift. From this pivot point, BTC transitioned into a consolidation phase, forming a broad range, which signals balance between buyers and sellers after the impulsive move. Price respected both the upper and lower boundaries of this range multiple times, confirming it as a valid accumulation zone. Eventually, Bitcoin broke below the range briefly, but this move was quickly absorbed by buyers near the Demand Zone around 86,800, leading to a strong recovery and reclaim of structure.
Currently, BTCUSDT is trading above the rising Demand Line, having confirmed a breakout and subsequent retest. Price is gradually moving higher toward the Supply Zone near 89,000, where multiple tests and rejections have already occurred. This area represents a key resistance, with sellers actively defending it, as shown by repeated reactions and failed continuation attempts.
My scenario: as long as BTCUSDT holds above the 86,800 Demand Zone and respects the rising demand line, the bias remains bullish and corrective pullbacks are likely to attract buyers. A clean breakout and acceptance above the 89,000 Supply Zone would confirm bullish continuation and open the door for further upside. However, failure to hold demand and a breakdown below the demand line would invalidate the bullish scenario and shift focus back toward range lows. For now, price is compressing between demand and supply, and a decisi

image
Plugin enabled
Plugin enabled
Plugin enabled
fxstreetforex
fxstreetforex
1 Plugin enabled ยทPlugin enabled

FTSE-100 finally tests 10,000EU mid-market update: FTSE-100 finally tests 10,000; European equities continue bullish momentum from strong 2025; Chip names up on Samsung and China AI IPO hype; Tesla to drop Q4 deliveries

image
Plugin enabled
Plugin enabled
Plugin enabled
fxstreetforex
fxstreetforex
1 Plugin enabled ยทPlugin enabled

It's 2026 and stocks rise, Gold hits $4,391, Oil up, crypto's up, bonds steadyGood morning and Happy New Year. Welcome to

image
Plugin enabled
Plugin enabled
Plugin enabled
fxstreetforex
fxstreetforex
1 Plugin enabled ยทPlugin enabled

FTSE 100 hits record high at 10,052The FTSE 100s brief rally above the 10,000 milestone is a powerful signal for UK markets, reflecting ongoing confidence in earnings resilience, attractive valuations and the growing appeal of UK equities to international investors at a time when policy headwinds are beginning to

image
Plugin enabled
Plugin enabled
Plugin enabled
fxstreetforex
fxstreetforex
1 Plugin enabled ยทPlugin enabled

US jobs report takes center stage next week Deutsche BankThe US jobs report will be the main economic release next week, with other US data including the ISM indices and consumer sentiment. Elsewhere, the focus will be on inflation in Europe and China, whilst wage data is due in Japan, Deutsche Bank's economists

image
Plugin enabled
Plugin enabled
Plugin enabled
fxstreetforex
fxstreetforex
1 Plugin enabled ยทPlugin enabled

GBP/USD dips below 1.3450 following final UK manufacturing PMI dataThe Pound has been rejected at 1.3475 on the early London trading session on Friday, and retreated to session lows at the 1.3450 area at the time of

image
Plugin enabled
Plugin enabled
Plugin enabled
ideas_EURUSD
ideas_EURUSD
1 Plugin enabled ยทPlugin enabled

EURUSD
Hello Traders!
What are your thoughts on EURUSD?
EURUSD reacted strongly after reaching a major resistance zone and has now entered a corrective phase.
The price has broken its short-term ascending trendline, which signals a potential shift in market structure and weakening bullish momentum.
We expect the price to complete a pullback toward the broken trendline / supply zone.
This area is likely to act as resistance, where consolidation and bearish rejection may occur.
After the pullback is completed, the preferred scenario is a continuation of the downside.
As long as price remains below the broken trendline and resistance zone, bearish pressure is expected to dominate.
Dont forget to like and share your thoughts in the comments!

image
Plugin enabled
Plugin enabled
Plugin enabled
fxstreetforex
fxstreetforex
1 Plugin enabled ยทPlugin enabled

USD/CHF stalls below 0.7940 in a calm New Year sessionThe US Dollar is trading practically flat against the Swiss Franc, right below the 0.7940 line, ahead of the US session opening on Friday, The pair has edged up from three-month lows at the 0.7860 area in late December, but it closed the 2025 year with a more than 12% decline.A combination of

image
Plugin enabled
Plugin enabled
Plugin enabled
fxstreetforex
fxstreetforex
1 Plugin enabled ยทPlugin enabled

If your stop loss feels well placed it probably isnt.Smart money doesnt enter randomly. It hunts liquidity.Most traders leave the same clues on the chart.And someone much bigger is waiting for them.There are obvious zones.And others almost no one looks at Especially in patterns like the Ending Wedge. Hint: the textbook stop is often the worst one.Ever been stopped out only to watch price move exactly as planned?Then this video is for you.
Liquidity Sweep Trading Strategy: How Smart Money targets your stop loss - YouTube#smartmoney #stoploss #liquiditysweep #endingwedge #fxstreet #shorts Smart money will take your stop loss if you place it in obvious areas.Learn how big mone...

image
Plugin enabled
Plugin enabled
Plugin enabled
fxstreetforex
fxstreetforex
1 Plugin enabled ยทPlugin enabled

2025 ends downUSD: Mar'26 isUpat

image
Plugin enabled
Plugin enabled
Plugin enabled
Showing 35 out of 274
  • 31
  • 32
  • 33
  • 34
  • 35
  • 36
  • 37
  • 38
  • 39
  • 40
  • 41
  • 42
  • 43
  • 44
  • 45
  • 46
  • 47
  • 48
  • 49
  • 50

Plugin enabled

Plugin enabled


Plugin enabled
Plugin enabled
Plugin enabled
Plugin enabled /home/xtreders.com/public_html/themes/wondertag/layout/modals/site-alerts.phtml on line 208

Warning: Trying to access array offset on value of type null in /home/xtreders.com/public_html/themes/wondertag/layout/modals/site-alerts.phtml on line 208
https://xtreders.com/setting&user=&page=monetization">Plugin enabled

Plugin enabled

Plugin enabled

Plugin enabled

Plugin enabled