Xtreders Xtreders
    #priceaction #kabhi_ta_trading #tradingview #supportresistance #cryptotrading
    Advanced Search
  • Login
  • Register

  • Night mode

    Select Language

  • Arabic
  • Bengali
  • Chinese
  • Croatian
  • Danish
  • Dutch
  • English
  • Event_api_key_regenerated
  • Event_api_limit_reached
  • Event_plugin_disabled
  • Event_plugin_enabled
  • Event_plugin_subscription_expired
  • Event_plugin_subscription_renewed
  • Event_plugin_subscription_started
  • Event_test
  • Filipino
  • French
  • German
  • Hebrew
  • Hindi
  • Indonesian
  • Italian
  • Japanese
  • Korean
  • Persian
  • Portuguese
  • Russian
  • Spanish
  • Swedish
  • Turkish
  • Urdu
  • Vietnamese

Watch

Watch Reels

Events

Browse Events My events

Blog

Browse articles

Pages

My Pages Liked Pages

More

Forum Explore Popular Posts Fundings
Reels
Watch
Events
Blog
My Pages
See all

Discover posts

Posts

Users

Pages

Group

Blog

Events

Forum

Fundings

Ideas_XAUUSD
Ideas_XAUUSD
1 w ยทTranslate

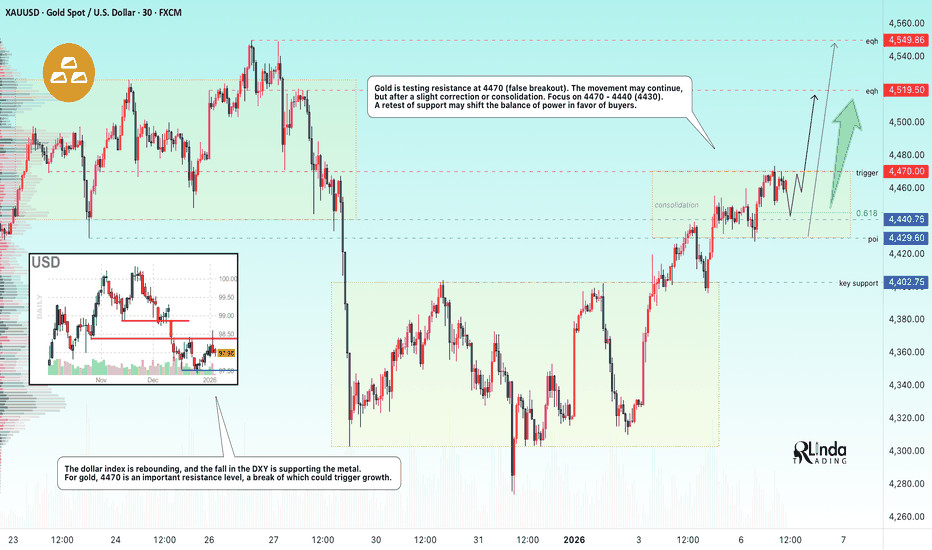
GOLD - Consolidation before resistance at 4470. Bullish trend
FX:XAUUSD resumes growth and tests 4470, an important resistance level, amid a weakening dollar caused by expectations of further easing of Fed policy and continuing geopolitical uncertainty.
Expectations of a Fed rate cut intensified after the release of weak ISM Manufacturing PMI data.
Geopolitical risks have temporarily receded into the background, but remain a potential catalyst for a new wave of demand for safe-haven assets.
Attention is shifting to US labor market data (ADP report and JOLTS vacancies on Wednesday, NFP on Friday). Weak employment figures could increase pressure on the dollar and support gold.
Important nuances: China and Russia's reaction to US actions in Venezuela, as well as the open conflict between Russia and Ukraine.
Further dynamics will depend on employment data and a possible escalation of the geopolitical situation. A break above $4470 will open the way to testing higher levels.
Resistance levels: 4470, 4488, 4519
Support levels: 4440, 4430, 4400
If the metal does not pull back from 4470 and continues to storm the resistance, then attempts to continue growth from 4470 can be considered. Otherwise, the market may test 4440-4430 before rising (long squeeze). Within the current cycle, gold has a chance to test its ATH.
Best regards, R. Linda!

image
Like
Comment
Share
fxstreetforex
fxstreetforex
1 w ยทTranslate

What if you could trade with someone elses money? Thats prop trading and its booming in 2025.But do you really know everything you need before jumping in?Our article breaks down how prop trading works, what happens if you lose, how to choose the right firm, and much more. Access our full guide:
Best Prop Trading Firms in 2026 - FXStreetChoose a top-tier Best Prop Trading Firms. Our 2026 analysis reviews the Best Prop Trading Firms 4 brokers and gives you the insights needed to make an informed decision.

image
Like
Comment
Share
fxstreetforex
fxstreetforex
1 w ยทTranslate

S&P 500 holds bullish structure despite corrective pullback [Video]We talked about SP500 at the end of 2025, specifically on December 19, where we mentioned and highlighted that bulls are still here and we can expect more gains after a

image
Like
Comment
Share
fxstreetforex
fxstreetforex
1 w ยทTranslate

AUD/USD: Likely to test 0.6750 before the risk of a pullback increase UOB GroupThere is scope for Australian Dollar (AUD) to test 0.6750 before the risk of a pullback increases; 0.6770 is not expected to come into view. In the longer run, AUD could edge higher, but it remains to be seen if it can reach 0.6770, UOB Group's FX analysts Quek Ser Leang and Peter Chia

image
Like
Comment
Share
Ideas_XAUUSD
Ideas_XAUUSD
1 w ยทTranslate

Gold Jumps on Geopolitical Shock Rally Exhausted or Correction?
Gold ( OANDA:XAUUSD ) opened the week higher as global markets reacted to rising geopolitical tensions.
The main driver was the weekend arrest of Venezuelas president, Nicols Maduro, by the United States, which increased global uncertainty and boosted safe-haven demand.
Ongoing tensions in the Middle East and the RussiaUkraine war continue to support gold as a hedge against geopolitical risk.
As I previously expected , gold has begun to rise and has reached its targets (full target).
Gold is currently attempting to break the resistance zone($4,467-$4,43.
From an Elliott Wave perspective, it seems that gold is in the process of completing a Double Three Correction(WXY) in an Ascending Broadening Wedge Pattern.
I expect that Gold will begin to decline and potentially drop at least to around $4,391.
First Target: $4,391
Second Target: $4,346
Stop Loss(SL): $4,540(Worst)
Points may shift as the market evolves
What do you think? Will gold continue its bullish trend into 2026, or should we expect a correction? Id love to hear your thoughts!
Please respect each other's opinions and express agreement or disagreement politely.
Gold Analyze (XAUUSD), 1-hour time frame.
Always set a Stop Loss(SL) for every position you open.
This is just my idea; Id love to see your thoughts too!
If you find it helpful, please BOOST this post and share it with your friends.

image
Like
Comment
Share
fxstreetforex
fxstreetforex
1 w ยทTranslate

A new all time high for the Dow JonesEmini S&P March futures longs at support at 6900/6890 are working as we hit my targets of 6935/6945, 6973/75 &

image
Like
Comment
Share
fxstreetforex
fxstreetforex
1 w ยทTranslate

When is the Eurozone Prelim HICP inflation and how could it affect EUR/USD?The Eurostat will publish the preliminary Eurozone Harmonized Index of Consumer Prices (HICP) data for December later on Wednesday at 100

image
Like
Comment
Share
fxstreetforex
fxstreetforex
1 w ยทTranslate

Risk rally pauses, as the focus shifts to geopolitical and macro risksThe global stock market rally that has taken financial markets by storm in recent days has lost momentum as we move through the week. Asian stocks fell by more than 1%, commodities are also lower, with gold, oil and siler all

image
Like
Comment
Share
ideas_BTCUSDT
ideas_BTCUSDT
1 w ยทTranslate

BTCUSDT Holding Higher Lows, $94,700 Resistance in Focus
Hello traders! Heres my technical outlook on BTCUSDT (3H) based on the current chart structure. BTCUSDT initially experienced a strong sell-off, marked by aggressive bearish momentum as price dropped from higher levels. After this decline, the market found a base and started to grow, transitioning into an ascending channel. This phase showed a clear shift in control from sellers to buyers, supported by a rising support line and multiple bullish reactions along the channel. However, as price approached the upper boundary of the channel and the Seller Zone, upside momentum began to slow. During this phase, BTC formed several fake breakouts and failed attempts to hold above resistance, signaling strong selling pressure near the highs. Price then broke back below short-term structure and entered a consolidation phase, forming a clear range. This range reflected temporary balance, with buyers defending the lower boundary while sellers capped the upside. Recently, BTC broke out from the range to the upside and reclaimed the Buyer Zone, confirming renewed bullish intent. Price is now trading above key support around 91,50092,000 and is respecting the rising support line, indicating that buyers are actively defending pullbacks. The current move is pushing price back toward the Resistance Level and Seller Zone around 94,700, where a test is expected. My scenario: as long as BTCUSDT holds above the Buyer Zone and the rising support line, the bullish bias remains intact. I expect price to retest the 94,700 Resistance, with TP1 aligned near this level. A clean breakout and acceptance above resistance would confirm bullish continuation and open the door for higher targets. However, a strong rejection from the Seller Zone followed by a breakdown below support would invalidate t

image
Like
Comment
Share
fxstreetforex
fxstreetforex
1 w ยทTranslate

Oneok Inc. (OKE) stock sinks as market gains: Here's whyOneok Inc. (OKE) closed the most recent trading day at $70.87, moving -3.77% from the previous trading session. The stock fell short of the S&P 500, which registered a gain of 0.62% for the day. Meanwhile, the Dow gained 0.99%, and the Nasdaq, a tech-heavy index, added

image
Like
Comment
Share
Showing 24 out of 274
  • 20
  • 21
  • 22
  • 23
  • 24
  • 25
  • 26
  • 27
  • 28
  • 29
  • 30
  • 31
  • 32
  • 33
  • 34
  • 35
  • 36
  • 37
  • 38
  • 39

Edit Offer

Add tier


Select an image
Delete your tier
Are you sure you want to delete this tier?
In order to sell your content and posts, start by creating a few packages. /home/xtreders.com/public_html/themes/wondertag/layout/modals/site-alerts.phtml on line 208

Warning: Trying to access array offset on value of type null in /home/xtreders.com/public_html/themes/wondertag/layout/modals/site-alerts.phtml on line 208
https://xtreders.com/setting&user=&page=monetization">Monetization

Pay By Wallet

Payment Alert

You are about to purchase the items, do you want to proceed?

Request a Refund