Xtreders Xtreders
    #priceaction #tradingview #kabhi_ta_trading #technicalanalysis #btcusdt
    Advanced Search
  • Login
  • Register

  • Night mode

    Select Language

  • Arabic
  • Bengali
  • Chinese
  • Croatian
  • Danish
  • Dutch
  • English
  • Event_api_key_regenerated
  • Event_api_limit_reached
  • Event_plugin_disabled
  • Event_plugin_enabled
  • Event_plugin_subscription_expired
  • Event_plugin_subscription_renewed
  • Event_plugin_subscription_started
  • Event_test
  • Filipino
  • French
  • German
  • Hebrew
  • Hindi
  • Indonesian
  • Italian
  • Japanese
  • Korean
  • Persian
  • Portuguese
  • Russian
  • Spanish
  • Swedish
  • Turkish
  • Urdu
  • Vietnamese

Watch

Watch Reels

Events

Browse Events My events

Blog

Browse articles

Pages

My Pages Liked Pages

More

Forum Explore Popular Posts Fundings
Reels
Watch
Events
Blog
My Pages
See all

Discover posts

Posts

Users

Pages

Group

Blog

Events

Forum

Fundings

ideas_BTCUSDT
ideas_BTCUSDT
5 w ยทTranslate

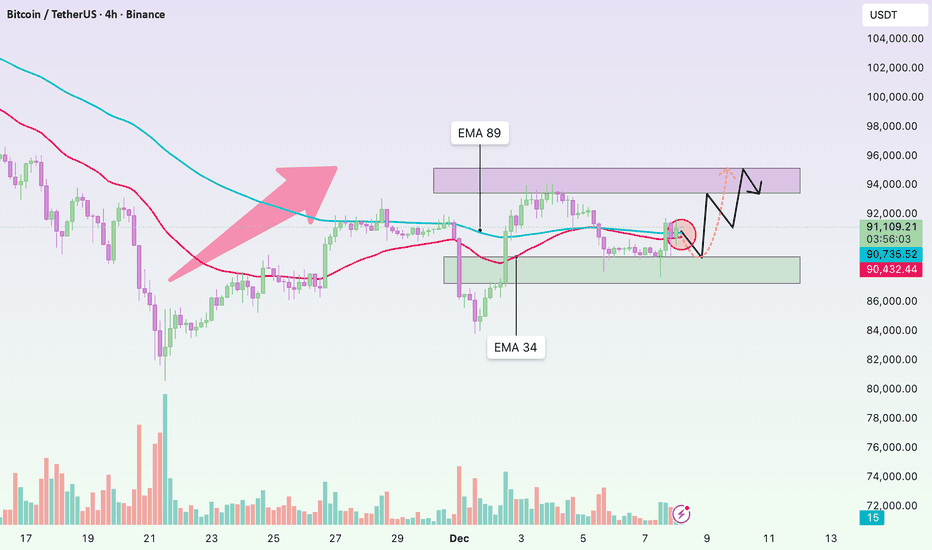
EMA 34 & 89 Signal That the Uptrend Is Still Not Confirmed
Hello everyone,
BTC is currently in a clear transition phase as the 34 EMA (red) remains below the 89 EMA (blue), or has only barely crossed upward without forming enough separation to confirm a new bullish trend. Price is hovering around 91,00092,000, sticking closely to the EMA cluster, which at this stage acts more as dynamic resistance than a reliable support. Looking left on the chart, the 92,000 zone corresponds to the previous distribution top a major supply area filled with trapped orders making any breakout attempt even more difficult. In other words, BTC is simply retesting the 3489 EMA cluster combined with old supply, and the probability of a strong immediate reversal is relatively low.
From a macro perspective, the hesitation becomes even more understandable. The Federal Reserve and its rate-cut path remain the biggest variables: markets expect further cuts, but nothing official has been delivered. Without clarity on how dovish the Fed intends to be, major funds are unlikely to aggressively rotate into risk-on assets like crypto. Liquidity inflows also remain muted no new spot ETF catalysts, no institutional accumulation announcements, and on-chain data shows no strong capital inflow into BTC. As a result, price has enough momentum to retest EMAs, but not enough to break through resistance and establish a sustainable uptrend. Sentiment is also mixed: short-term traders are taking profit into resistance after the recent dump, while buyers prefer to wait for clearer Fed signals, limiting the strength of any chase buying.
Given this backdrop, I still view the current recovery as a technical bounce within a broader weak structure. With the 34 EMA yet to meaningfully separate above the 89 EMA and price still fluctuating around 9192k, BTC

image
Like
Comment
Share
fxstreetforex
fxstreetforex
5 w ยทTranslate

Morning briefingThe FED cut the rates by 25-bps thereby bringing it down to 3.75%.The Dollar Index has turned lower as anticipated and it can test 98-97 before rebounding later. EURUSD & EURINR can head towards 1.18 & 106 in the near term. EURJPY need to sustain above 182 to rise towards

image
Like
Comment
Share
Ideas_XAUUSD
Ideas_XAUUSD
5 w ยทTranslate

Lingrid | GOLD Ranging Market Remains in Play
OANDA:XAUUSD continues to rotate between well-defined resistance near 42604270 and demand around 41604170, confirming a sustained sideways environment. Repeated rejections from the upper boundary and controlled pullbacks suggest neither side has full control yet. The recent A-B-C decline fits a corrective move inside the broader consolidation rather than a trend reversal.
Price is now pressing into the lower range support, aligned with channel border and historical reaction zone. A structural hold here could trigger another rotation higher toward 4,212, while sellers are likely to re-engage near the upper band. Until a decisive breakout occurs, fading the range edges offers the higher-probability setups.
Primary scenario: hold above 4160 bounce toward 4,212
Risk scenario: clean loss of 4160 shifts focus to deeper downside and range breakdown potential
If this idea resonates with you or you have your own opinion, traders, hit the comments. Im excited to read your thoughts!

image
Like
Comment
Share
fxstreetforex
fxstreetforex
5 w ยทTranslate

USD/CAD hangs near its lowest level since October 22, seems vulnerable below 1.3800The USD/CAD pair enters a bearish consolidation phase during the Asian session on Thursday and oscillates in a narrow band, just below the 1.3800 mark, or its lowest level since October

image
Like
Comment
Share
ideas_EURUSD
ideas_EURUSD
5 w ยทTranslate

Lingrid | EURUSD Trend Continuation Pattern Break Confirmed ?
FX:EURUSD perfectly played out my previous trading idea . Price has broken above the descending trendline and the flag formation, confirming renewed bullish momentum within the broader upward channel. Price defended the higher-low area near the channel support and reclaimed the mid-range zone, signaling strong buyer control after consolidation. The structure now favors continuation rather than rejection, with momentum gradually building.
As long as price holds above the 1.1640 support range, buyers remain in control and the pair can rotate higher toward the 1.1700 resistance band. A clean push through this level would open space for further extension along the ascending channel, while shallow pullbacks are likely to be absorbed.
Primary scenario: structure holds continuation toward 1.1700.
Risk scenario: break below channel exposes a deeper retracement into the lower support zone.
If this idea resonates with you or you have your own opinion, traders, hit the comments. Im excited to read your thoughts!

image
Like
Comment
Share
fxstreetforex
fxstreetforex
5 w ยทTranslate

Japans Kihara says closely watching impact of US financial conditions after Fed rate cutJapanese Chief Cabinet Secretary Minoru Kihara said on Thursday that the government will closely monitor the impact on the Japanese economy of United States (US) financial conditions following Federal Reserve (Fed) rate

image
Like
Comment
Share
Ideas_XAUUSD
Ideas_XAUUSD
5 w ยทTranslate

GOLD 4H CHART ROUTE MAP UPDATE & TRADING PLAN FOR THE WEEK
Hey Everyone,
Please see our 4h chart remaining levels and targets for the coming week with one updated Goldturn.
We are now seeing price play between two weighted levels with a gap above at 4222 and a gap below at 4124. We will need to see ema5 cross and lock on either weighted level to determine the next range.
We will see levels tested side by side until one of the weighted levels break and lock to confirm direction for the next range.
We will keep the above in mind when taking buys from dips. Our updated levels and weighted levels will allow us to track the movement down and then catch bounces up.
We will continue to buy dips using our support levels taking 20 to 40 pips. As stated before each of our level structures give 20 to 40 pip bounces, which is enough for a nice entry and exit. If you back test the levels we shared every week for the past 24 months, you can see how effectively they were used to trade with or against short/mid term swings and trends.
The swing range give bigger bounces then our weighted levels that's the difference between weighted levels and swing ranges.
BULLISH TARGET
4222
EMA5 CROSS AND LOCK ABOVE 4222 WILL OPEN THE FOLLOWING BULLISH TARGET
4328
EMA5 CROSS AND LOCK ABOVE 4328 WILL OPEN THE FOLLOWING BULLISH TARGET
4422
EMA5 CROSS AND LOCK ABOVE 4422 WILL OPEN THE FOLLOWING BULLISH TARGET
4494
BEARISH TARGETS
4131
EMA5 CROSS AND LOCK BELOW 4131 WILL OPEN THE FOLLOWING BEARISH TARGET
4042
EMA5 CROSS AND LOCK BELOW 4042 WILL OPEN THE SWING RANGE
3964
3873
As always, we will keep you all updated with regular updates throughout the week and how we manage the active ideas and setups. Thank you all for your likes, comments and follows, we really appreciate it!
Mr Gold
GoldViewFX

image
Like
Comment
Share
fxstreetforex
fxstreetforex
5 w ยทTranslate

PBOC sets USD/CNY reference rate at 7.0686 vs. 7.0753 previousThe Peoples Bank of China (PBOC) sets the USD/CNY central rate for the trading session ahead on Thursday at 7.0686 compared to the previous day's fix of

image
Like
Comment
Share
Ideas_XAUUSD
Ideas_XAUUSD
5 w ยทTranslate

XAUUSD
Hello Traders!
What are your thoughts on GOLD?
Gold continues to trade within a short-term ascending channel and is now approaching the upper boundary of this structure. This region also aligns with a major resistance zone formed by the previous swing high, creating a strong confluence area.
As price enters this resistance cluster, we expect selling pressure and a potential rejection. Based on the current momentum, it does not appear likely that gold will easily break above this zone in the short term.
Therefore, the more probable scenario is:
1-A pullback toward the lower boundary of the ascending channel
2- If the channel breaks to the downside, an extended decline toward the next key support level becomes likely
Dont forget to like and share your thoughts in the comments!

image
Like
Comment
Share
ideas_EURUSD
ideas_EURUSD
5 w ยทTranslate

EURUSD:Rate Cut Priced In - Can Powell Boost the Dollar Again?
From our previous analysis on EURUSD, the price created a move above the structure area, opening the door for further growth. But what could happen during the FOMC?
Could this be just a false bullish breakout, and the price could fall again?
As we have seen over the past few weeks, the US economy continues to report strong economic data. The decline in the employment number is also normal considering that it has been showing only growth in employment data for two years or more. In my opinion, these ups and downs are normal.
The market expects the FED to cut interest rates on Wednesday and the 25 basis point rate cut is already priced in. The market is mainly focused on the Interest Rate Projection and the message that Powell may share for the upcoming meeting.
Considering that Powell has been hawkish towards the USD at every meeting, it is possible that he will maintain a hawkish tone again and we could see the USD strengthen despite the current speculation.
However, it will be a volatile and risky market during the FOMC and it will be better to be cautious with all USD pairs.
You may find more details in the chart!
Thank you and Good Luck!
PS: Please support with a like or comment if you find this analysis useful for your trading day

image
Like
Comment
Share
Showing 207 out of 281
  • 203
  • 204
  • 205
  • 206
  • 207
  • 208
  • 209
  • 210
  • 211
  • 212
  • 213
  • 214
  • 215
  • 216
  • 217
  • 218
  • 219
  • 220
  • 221
  • 222

Edit Offer

Add tier


Select an image
Delete your tier
Are you sure you want to delete this tier?
In order to sell your content and posts, start by creating a few packages. /home/xtreders.com/public_html/themes/wondertag/layout/modals/site-alerts.phtml on line 208

Warning: Trying to access array offset on value of type null in /home/xtreders.com/public_html/themes/wondertag/layout/modals/site-alerts.phtml on line 208
https://xtreders.com/setting&user=&page=monetization">Monetization

Pay By Wallet

Payment Alert

You are about to purchase the items, do you want to proceed?

Request a Refund