Xtreders Xtreders
    #priceaction #tradingview #kabhi_ta_trading #technicalanalysis #btcusdt
    Advanced Search
  • Login
  • Register

  • Night mode

    Select Language

  • Arabic
  • Bengali
  • Chinese
  • Croatian
  • Danish
  • Dutch
  • English
  • Event_api_key_regenerated
  • Event_api_limit_reached
  • Event_plugin_disabled
  • Event_plugin_enabled
  • Event_plugin_subscription_expired
  • Event_plugin_subscription_renewed
  • Event_plugin_subscription_started
  • Event_test
  • Filipino
  • French
  • German
  • Hebrew
  • Hindi
  • Indonesian
  • Italian
  • Japanese
  • Korean
  • Persian
  • Portuguese
  • Russian
  • Spanish
  • Swedish
  • Turkish
  • Urdu
  • Vietnamese

Watch

Watch Reels

Events

Browse Events My events

Blog

Browse articles

Pages

My Pages Liked Pages

More

Forum Explore Popular Posts Fundings
Reels
Watch
Events
Blog
My Pages
See all

Discover posts

Posts

Users

Pages

Group

Blog

Events

Forum

Fundings

ideas_EURUSD
ideas_EURUSD
5 w ยทTranslate

EURUSD Coiling for Breakdown Triangle Ready to Crack
EURUSD Analysis Bearish Breakout Setting Up
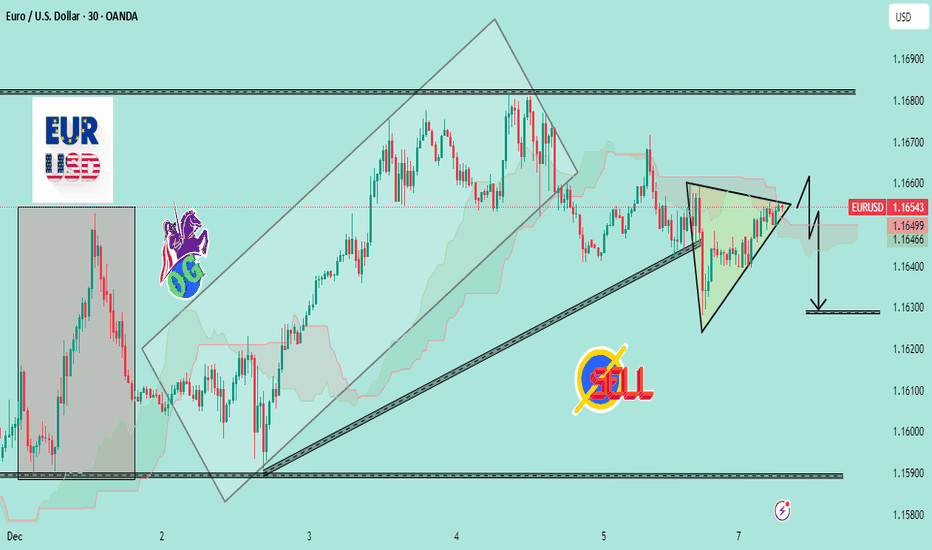
EURUSD is trading inside a tight symmetrical triangle after breaking its previous ascending channel. Price is compressing right under the Ichimoku cloud, showing weak buying momentum.
The structure suggests a bearish continuation:
The uptrend channel is already broken, shifting market bias from bullish to neutralbearish.
Price is repeatedly getting rejected at the triangles upper boundary showing sellers defending the level.
The cloud is flat and thin, signaling lack of bullish strength.
A clean break below the triangle support should trigger downside continuation toward the next demand level.
Bearish Trigger
A breakout below 1.1640 with momentum confirms the sell.
Downside Target
TP: 1.1630 zone (marked on chart)
Invalid Setup
If price breaks above the triangle and closes inside the previous range, the bearish setup weakens

image
Like
Comment
Share
ideas_BTCUSDT
ideas_BTCUSDT
5 w ยทTranslate

Bitcoin Roadmap | Short-term
Bitcoin( BINANCE:BTCUSDT ) began to decline from the resistance zone($95,020-$94,84 exactly as expected in my previous idea , successfully reaching all targets.
At the moment, Bitcoin was able to break the support zone($90,650-$90,00. It seems that the pullback to the broken support zone($90,650-$90,00 could be completed with a symmetrical triangle pattern, although given the low trading volume on Saturday and Sunday, this triangle may not function properly.
In terms of Elliott Wave theory, Bitcoin appears to be completing the microwave C of the main wave B, and I expect at least one more impulsive 5-wave move to the upside.
I expect Bitcoin to start rising from the support zone($89,230-$88,00 or the Potential Reversal Zone(PRZ) maximum. A break of the resistance lines could be a good sign for Bitcoin to rise again.
What do you think? Do you believe Bitcoin will dip below $75,000, or will it bounce back?
Cumulative Short Liquidation Leverage: $98,260-$96,690
Cumulative Short Liquidation Leverage: $90,560-$89,990
Cumulative Long Liquidation Leverage: $87,820-$87,290
Cumulative Long Liquidation Leverage: $83,900-$82,400
First Target: $89,911
Second Target: $92,119
Stop Loss(SL): $86,120(Worst)
Points may shift as the market evolves
Please respect each other's opinions and express agreement or disagreement politely.
Bitcoin Analysis (BTCUSDT), 1-hour time frame.
Always set a Stop Loss(SL) for every position you open.
This is just my idea; Id love to see your thoughts too!
If you find it helpful, please BOOST this post and share it with your friends.

image
Like
Comment
Share
fxstreetforex
fxstreetforex
5 w ยทTranslate

Summary of the BoC event: Economic resilience and data-dependent stanceAs widely anticipated, the Bank of Canada (BoC) kept its benchmark interest rate at 2.25% at its event on

image
Like
Comment
Share
ideas_EURUSD
ideas_EURUSD
5 w ยทTranslate

EURUSD: Buyers Push Toward the 1.1680 Triangle Resistance Break
Hello everyone, here is my breakdown of the current EURUSD setup.
Market Analysis
EURUSD is transitioning out of a prolonged bearish phase that previously unfolded inside a well-defined downward channel. After forming a major swing low in early November, the pair initiated a recovery and gradually shifted into a corrective bullish structure. Price is now trading inside a developing triangle formation, defined by the ascending Triangle Support Line and the descending Triangle Resistance Line. During the decline, the market repeatedly respected the key Support Zone around 1.16200, which acted as a strong demand area and triggered bullish reactions on multiple occasions. Most recently, EURUSD completed a clear Head and Shoulders reversal pattern near the lower boundary, signaling exhaustion of sellers and the start of buyer control. Following this structure, price broke above the support zone and is now consolidating above it, confirming the zone as a valid demand base.
Currently, the pair is approaching the major Resistance Zone at 1.16800, which also aligns with the descending triangle resistance. This area remains the key upside barrier for buyers and represents a critical decision point for the market.
My Scenario & Strategy
My scenario is bullish, as long as price remains above the 1.16200 Support Zone and continues respecting the ascending Triangle Support Line. I expect EURUSD to maintain upward pressure and attempt a breakout toward the 1.16800 resistance, which is the next major supply area. A clean breakout above this zone would confirm bullish continuation and open the way for further upside toward higher targets.
However, if price reaches the resistance and shows strong rejection, a corrective pullback back toward the 1.16200 demand may occur. Still, the

image
Like
Comment
Share
Ideas_XAUUSD
Ideas_XAUUSD
5 w ยทTranslate

Gold - The bullrun top happens now!
Gold ( OANDA:XAUUSD ) is heading for a major reversal:
Analysis summary:
After the all time high breakout back in 2024, Gold has been rallying about +115% until today. During this entire move, Gold did not create any real correction. Considering that Gold is currently retesting a major resistance trendline, the bullrun top happens now.
Levels to watch:
$4,000
SwingTraderPhil
SwingTrading.Simplified. | Investing.Simplified. | #longtermvision

image
Like
Comment
Share
fxstreetforex
fxstreetforex
5 w ยทTranslate

USD/CAD strengthens after BoC keeps policy steady; Fed in the spotlightThe Canadian Dollar (CAD) trades under pressure against the US Dollar (USD) on Wednesday as markets digest the latest interest rate decision from the Bank of Canada

image
Like
Comment
Share
ideas_BTCUSDT
ideas_BTCUSDT
5 w ยทTranslate

Bitcoin Breakdown After Perfect Bounce Short Setup Loading
As I expected , Bitcoin bounced from the support zone and reached its targets.
Right now, Bitcoin has rejected from resistance lines and successfully broke both the support line and the support zone($90,650-$90,00.
From an Elliott Wave perspective, it appears that Bitcoin has completed a ZigZag structure, and we should now anticipate the start of a bearish wave sequence.
The S&P 500 inde SP:SPX ) also shows a bearish outlook, and given Bitcoins correlation with SPX, further downside in BTC is not surprising.
At the same time, USDT.D%( CRYPTOCAP:USDT.D ) has turned bullish againat least in the short termwhich can add additional pressure on Bitcoin.
I expect Bitcoin to continue its downward movement, at least toward the next support zone($87,140-$85,29 and the lower line of the ascending channel.
Note: Its better to wait for a bullish correction before entering, and then take a short position according to your own strategy.
Cumulative Short Liquidation Leverage: $98,260-$96,690
Cumulative Short Liquidation Leverage: $93,040-$92,560
Cumulative Long Liquidation Leverage: $94,840-$94,100
Cumulative Long Liquidation Leverage: $83,900-$82,400
Target: $87,733
Stop Loss(SL): $92,723(Worst)
Points may shift as the market evolves
Please respect each other's opinions and express agreement or disagreement politely.
Bitcoin Analysis (BTCUSDT), 1-hour time frame.
Always set a Stop Loss(SL) for every position you open.
This is just my idea; Id love to see your thoughts too!
If you find it helpful, please BOOST this post and share it with your friends.

image
Like
Comment
Share
Ideas_XAUUSD
Ideas_XAUUSD
5 w ยทTranslate

Gold next week Key S/R Levels and Outlook for Traders
GOLD WEEKLY SNAPSHOT BY PROJECTSYNDICATE
Swing High / Swing Low
$4,265 ~$4,164 clean rejection from the 4,26x breakout zone with a long upper wick, but weekly close still near $4,200, keeping price pinned in the upper part of the broader $4k range.
Trend
Higher-timeframe: Structural bull trend intact while price holds above the $3,940$4,000 block.
Tactical: Last weeks failed extension above $4,250 and the close back near $4,200 tilt the tape into distributive mode:
Rallies into $4,250 / $4,340 = sell-side liquidity magnets.
Downside liquidity sits lower at $4,075 / $3,940, making upside risk/reward look asymmetric to the downside from current levels.
Supports Buy-Side Liquidity / Downside Objectives
$4,130$4,100:
Short-term intraday pivot where buyers repeatedly stepped in last week; first micro-reaction zone on any flush.
$4,090$4,075 Buy-side liquidity #1
First true BSL pocket below the close; ideal TP1 for shorts from above and a spot where responsive dip-buyers are likely to probe.
$4,020$4,000:
Psychological shelf; loss of 4k would confirm that local distribution is winning and open the deeper BSL run.
$3,960$3,940 Buy-side liquidity #2 / structural block
Higher-timeframe demand and key liquidity magnet for a fuller corrective leg. A sustained break/acceptance below $3,940 would signal that the 2025 blow-off is transitioning into broader mean-reversion rather than shallow consolidation.
Resistances Sell-Side Liquidity / Short-Side Focus
$4,220$4,250 Sell-side liquidity #1
First overhead supply from the prior weeks failed breakout structure and just under recent highs. Clean area for sell the rip probes and for late longs to de-risk.
$4,300

image
Like
Comment
Share
fxstreetforex
fxstreetforex
5 w ยทTranslate

Powell to 'temper bets' for January cut amid Fed civil warThe longest federal closure in American history means that Fed officials have been flying somewhat blind for a couple of months

image
Like
Comment
Share
ideas_BTCUSDT
ideas_BTCUSDT
5 w ยทTranslate

BTCUSDT Long: Demand Line Holds Path Toward 96,500 Opens Up
Hello, traders! BTCUSDT is respecting the Triangle Demand Line after completing a full bearish cycle inside the descending channel earlier. Sellers maintained control for an extended period, pushing price steadily lower until it reached the pivot point near 88,800, where buyers finally stepped in and broke the bearish structure. This pivot zone became the foundation for a new bullish sequence, with price forming higher lows along the Triangle Demand Line. After the breakout from the descending channel, BTCUSDT entered a consolidation Range, where multiple fake breakouts occurred on both sides. This range acted as a transition phase before buyers regained momentum. Following the range, price made another bullish attempt, but faced resistance near the 96,500 Supply Zone an area where sellers have shown strong activity in the past.
Currently, BTCUSDT is moving toward the Triangle Demand Line once again, retesting it as support. As long as buyers defend this trendline and price remains above the Demand Zone at 88,800, the bullish structure stays intact.
My scenario: if the trendline holds, BTCUSDT may bounce and continue moving toward the 96,500 resistance, which remains the main upside target for the current bullish leg. A clean breakout above 96,500 would open the path for stronger continuation. However, if price fails to hold the demand line, a corrective pullback toward the lower demand region becomes possible. For now, the market structure remains bullish while price respects the Triangle Demand Line. Manage your risk!

image
Like
Comment
Share
Showing 211 out of 281
  • 207
  • 208
  • 209
  • 210
  • 211
  • 212
  • 213
  • 214
  • 215
  • 216
  • 217
  • 218
  • 219
  • 220
  • 221
  • 222
  • 223
  • 224
  • 225
  • 226

Edit Offer

Add tier


Select an image
Delete your tier
Are you sure you want to delete this tier?
In order to sell your content and posts, start by creating a few packages. /home/xtreders.com/public_html/themes/wondertag/layout/modals/site-alerts.phtml on line 208

Warning: Trying to access array offset on value of type null in /home/xtreders.com/public_html/themes/wondertag/layout/modals/site-alerts.phtml on line 208
https://xtreders.com/setting&user=&page=monetization">Monetization

Pay By Wallet

Payment Alert

You are about to purchase the items, do you want to proceed?

Request a Refund