Gold- From weekly to 15m chart. Where are the trades?
These days, everyone has an opinion on Gold.
Most of them are bullish.
And to be fair — so am I.
But here is what many traders either don’t understand or simply ignore:
There is a huge difference between having an opinion and having a tradable opinion.
A tradable opinion is one that can actually be executed in the market, with leverage, risk control, and realistic stops — not just a direction on a chart.
This analysis is not about saying “Gold is bullish, it will go to 6k or 7k, I’m a genius if it does.”
It’s about giving traders something they can actually work with.
🔎 Weekly Chart — Big Picture Reality
Three things stand out immediately:
1️⃣ The 5600 → 4400 drop
Yes, it was massive:
- ~12,000 pips
- large in percentage terms
- emotionally shocking
But in long-term trend terms?
👉 Just a correction.
Even if we measure only the 2025 rally, the drop didn’t even reach a 50% retracement.
2️⃣ Technical respect of structure
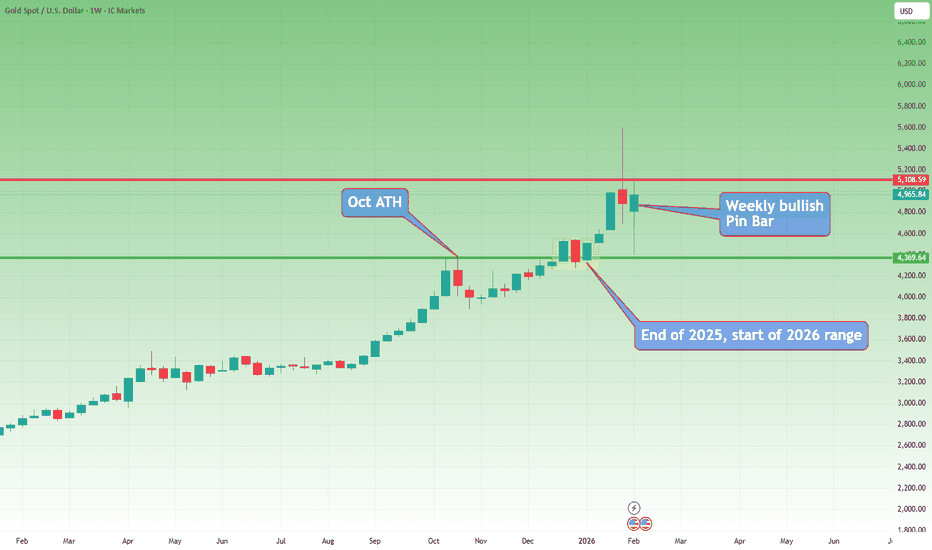
The decline stopped almost exactly at the October 2025 ATH, which acted as support.
Markets remember levels.
This is not random.
3️⃣ Alignment with congestion
The drop also aligned with:
- the late-December congestion zone
- the starting price of 2026
The first prices of the year often act as major S/R zones.
This is classic market behavior.
✅ Conclusion from Weekly:
Trend is bullish. No debate here.
❌ But tradable?
Not really.
Why?
Because a correct structural stop would be ~8,000 pips away.
With leverage, that’s not trading — that’s praying.
🔎 Daily Chart — Still Bullish, Still Not Tradable
On the daily:
- clean reversal from support
- first impulsive leg up
- pullback forming a higher low
- recent Piercing Line bullish pattern
Again:
✅ Bullish structure
❌ Not t