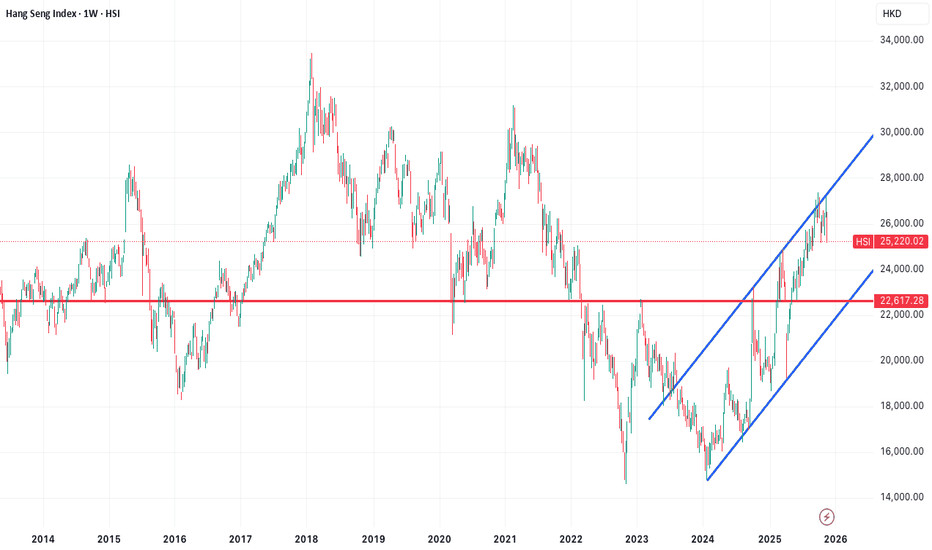
HSI technical outlook
The chart displays the long-term price action of the Hang Seng Index
, with technical features that highlight recent market dynamics. The blue trend lines define an upward channel, evidencing the index’s recovery pattern since its 2022 low and illustrating sustained bullish momentum. The red horizontal line, drawn at approximately 22,536, serves as a critical pivot and support level that has held significance through multiple past cycles. Importantly, this 22,536 level is not only a historical support, but also marks the 0.382 Fibonacci retracement from the 2022 low to the recent high, reinforcing its technical importance to traders. The recent downturn from the upper channel suggests weakening momentum, and points to the likelihood of the index soon testing this major support level; a decisive break could potentially signal a more pronounced correction.