Analysis on HSI: Uptrend but down momentum
Dear ALl
Currently, it is in uptrend, as long as 26000 can hold
Otherwise, it would come down to the zone 25000-25500 again
Best Regards,
TraderPP
Comment
Share


Analysis on HSI: Uptrend but down momentum
Dear ALl
Currently, it is in uptrend, as long as 26000 can hold
Otherwise, it would come down to the zone 25000-25500 again
Best Regards,
TraderPP
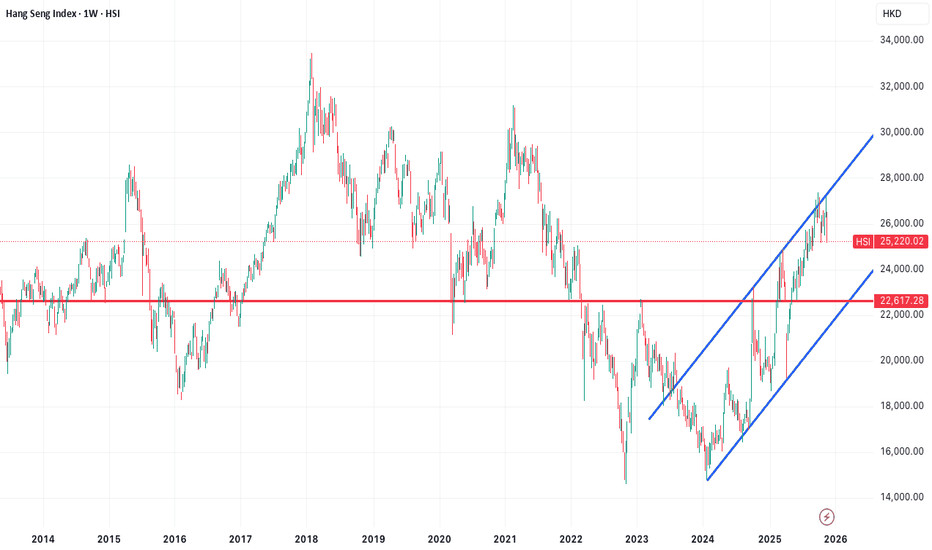
HSI technical outlook
The chart displays the long-term price action of the Hang Seng Index
, with technical features that highlight recent market dynamics. The blue trend lines define an upward channel, evidencing the index’s recovery pattern since its 2022 low and illustrating sustained bullish momentum. The red horizontal line, drawn at approximately 22,536, serves as a critical pivot and support level that has held significance through multiple past cycles. Importantly, this 22,536 level is not only a historical support, but also marks the 0.382 Fibonacci retracement from the 2022 low to the recent high, reinforcing its technical importance to traders. The recent downturn from the upper channel suggests weakening momentum, and points to the likelihood of the index soon testing this major support level; a decisive break could potentially signal a more pronounced correction.
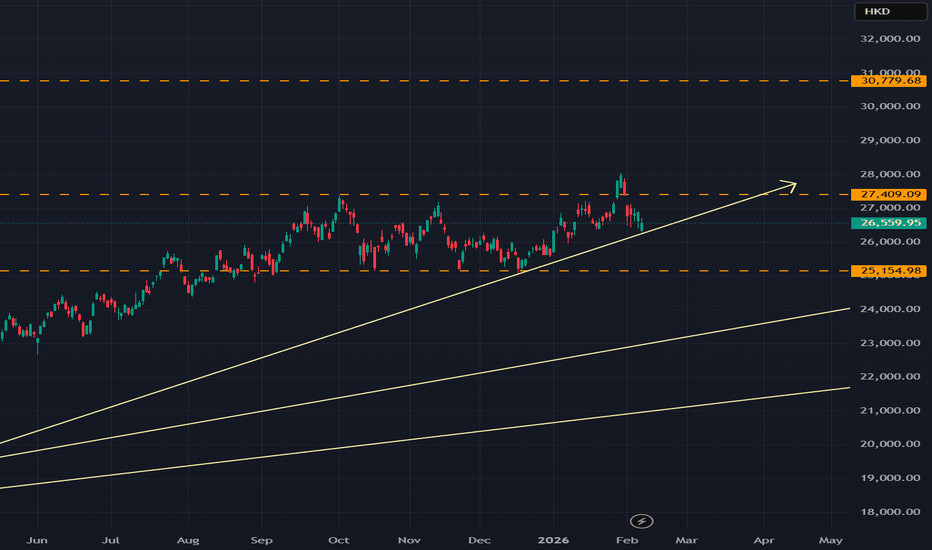
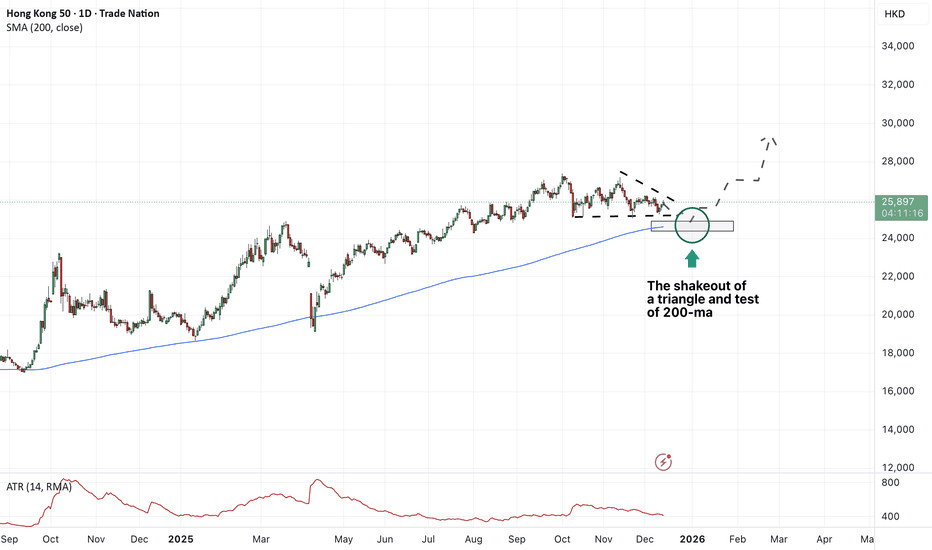
Hang Seng may be ready for the rally after testing 200-ma
The Hang Seng index is locked in a consolidation, right above the 200-day moving average.
The market loses volatility, and in order to find a trigger for the move, it may need to test the strategic support zone below (200-day moving average).
That’s the common pattern for the triangular formation - it might be shaken to both sides with quick price impacts before determining the direction.
The logical destination for the move would be the 24500 area: after testing this area, the market may reverse higher and find a buying pressure as shown at the chart below.
Don't forget - this is just the idea, always do your own research and never forget to manage your risk!
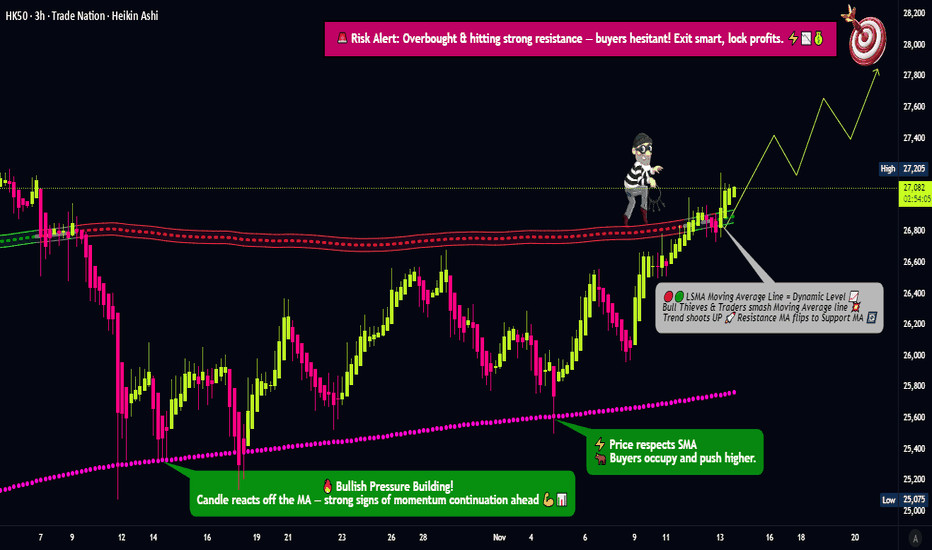
HK50 | Breakout Re-Test in Focus — Will Bulls Defend the Trend?
HONG KONG 50 (HK5 | Swing Trade Setup 🚀📈
🎯 BULLISH BREAKOUT CONFIRMED | Multi-Timeframe Confluence ✅
📊 TECHNICAL SETUP
✅ Weighted Moving Average (WMA) pullback completed
✅ LSMA Breakout confirmed on higher timeframes
✅ Bullish momentum building across all indicators
✅ Price action respecting key support zones
💰 TRADE PARAMETERS
🔵 ENTRY ZONE:
Flexible entry at current market price (CMP)
Multiple entry opportunities on pullbacks to support
🛑 STOP LOSS:
Suggested level: 26,500
⚠️ CRITICAL RISK DISCLAIMER: This is MY stop loss level based on MY risk tolerance. YOU MUST adjust according to YOUR:
Account size
Risk management rules (1-2% risk per trade recommended)
Trading strategy
Personal risk appetite
🎯 TARGET:
Primary target: 28,000 (approx. +5.6% from 26,500 level)
⚠️ Watch for strong resistance, overbought conditions, and potential bull traps
💡 Scale out profits as price approaches target
TAKE RESPONSIBILITY: Trail stops, lock profits, and exit at YOUR chosen levels
🌏 RELATED PAIRS TO WATCH (Correlation Analysis)
Asian Indices (High Correlation)
📈 HSI:HSI (Hang Seng Index) — Direct correlation, ~98% overlap
📈 CAPITALCOM:CN50 (China A5 — Mainland China exposure, ~85% correlation
📈 INDEX:NKY / FX:JPN225 (Nikkei 225) — Regional Asian sentiment, ~70% correlation
Global Risk-On Pairs (Moderate Correlation)
💵 OANDA:AUDUSD — China/Asia proxy, risk-on currency (~65% correlation)
💵 OANDA:NZDUSD — Asia-Pacific trade flows (~60% correlation)
💵 FX:USDCNH (USD/Chinese Yuan) — Inverse correlation, ~-75%
US Indices (Divergence Watch)
📊 FOREXCOM:SPX500 (S&P 50 — Global risk sentiment gauge
📊 PEPPERSTONE:NAS100 (Nasdaq) — Tech sector correlation with HK tech stocks
📊
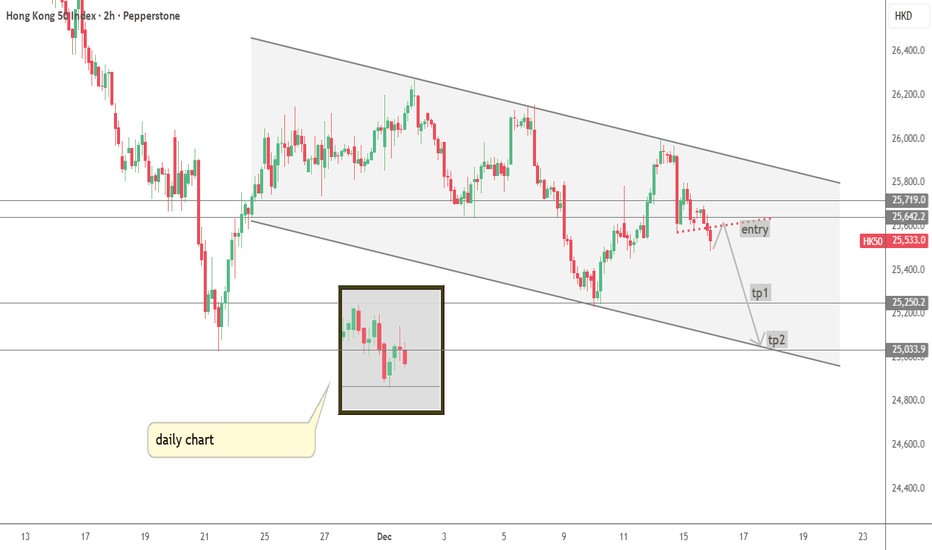
HK50--SHORT
--Short bias
--entry and tp levels are as shown on the chart