USDCHF - Anticipating the Price to Bounce off Weekly Support
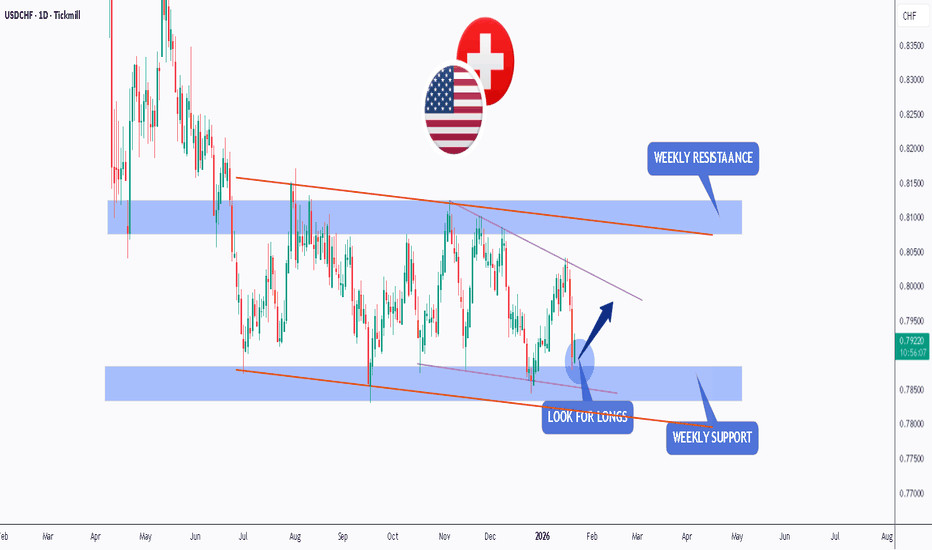
The image provided displays a technical analysis chart for the USD/CHF (US Dollar/Swiss Franc) currency pair on a weekly timeframe, showing price consolidation within a triangle pattern.
Chart Analysis and Trading Strategy 📊
The chart indicates the following key technical elements and a potential trading bias:
Currency Pair: USD/CHF. 💴
Pattern: The price action is consolidating within a "Triangle" or symmetrical triangle pattern, characterized by converging trendlines (lower highs and higher lows). This generally indicates a period of market indecision before a potential breakout.
Key Levels: 🎯
Weekly Resistance: A resistance zone is marked near the upper boundary of the triangle. A breakout above the resistance area (around 0.8145 according to recent analysis) would confirm a strong upward movement.
Weekly Support: A support area is indicated near the lower boundary of the triangle (around 0.7865). A break below this support would invalidate the bullish scenario and suggest further decline.
Indicated Bias: The annotation "LOOK FOR LONGS" suggests a bullish bias, anticipating that the price will bounce off the lower trendline/support and eventually break out to the upside. Other recent analyses on the pair also suggest a potential for recovery after testing key support levels. ⬆️