VIX (Volatility Index) – Daily Timeframe
Key message:
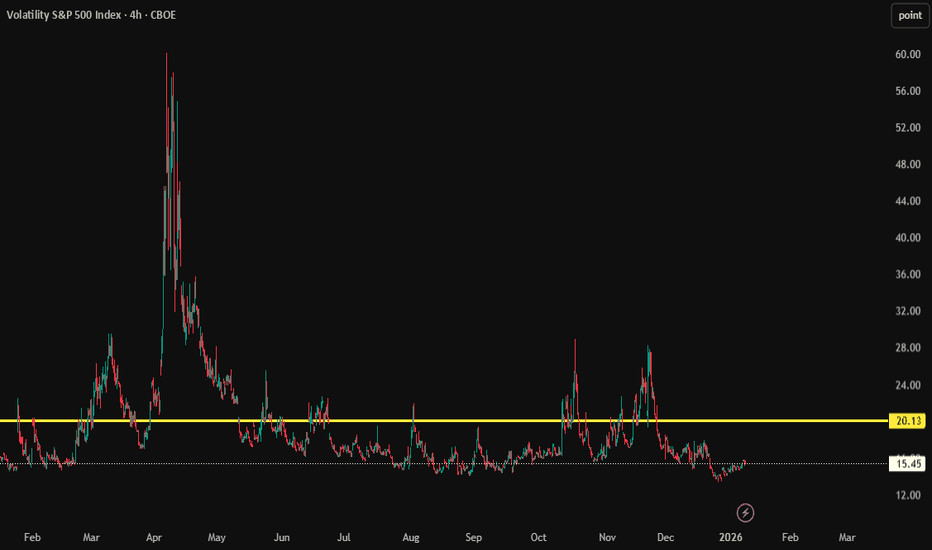
✅ VIX is good and healthy for indices as long as it stays below the yellow line (~20.1).
Why this level matters
The yellow line is the volatility threshold.
Below it = controlled fear, normal risk appetite.
Above it = stress, hedging, equity pressure.
Right now:
VIX is trading comfortably below the yellow line
No sustained daily close above it
Spikes are getting sold quickly, which is bullish for indices
What this tells us about indices
📈 Indices remain supported (SPX, US100, US3
Volatility is compressed and stable
Institutions are not pricing panic or protection
Old-school market truth:
Low VIX = money is relaxed = stocks go higher.
Important context
This is not extreme complacency, it’s healthy calm.
A slow grind lower in VIX is exactly what indices want for continuation.
Only a daily close above the yellow line would warn of risk-off behavior.
Conclusion
✔️ As long as VIX stays below the yellow line, indices remain bullish and safe.
⚠️ Caution only starts if VIX breaks and holds above it.
Calm volatility = bullish markets.
Simple. Proven. Timeless.
— Avo.Trades