S&P 500: Institutional Demand Zones vs. Macro Headwinds
S&P 500 (SPCFD) Strategic Market Analysis – 4H Timeframe
1. Market Structure & Price Action Overview
The S&P 500 is currently exhibiting a high-level consolidation within a dominant bullish trend. The price action at these peaks suggests a strategic liquidity engineering phase, where the market is balancing before its next directional expansion.
2. Key Liquidity Pools & Demand Zones
The technical map identifies two primary zones of institutional interest:
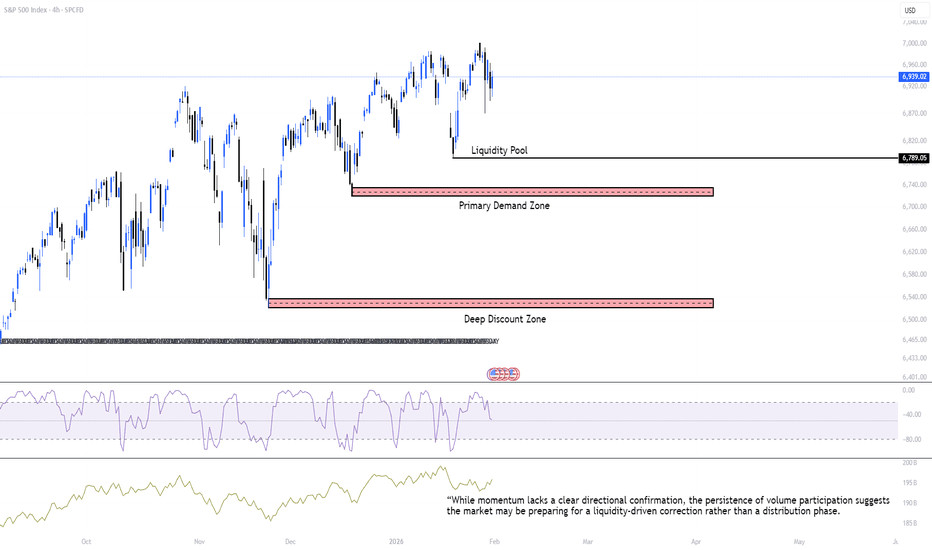
Sell-Side Liquidity (SSL) Target (6,789.05): This level represents the immediate swing low where retail stop-losses are likely clustered. An institutional "sweep" below this level would likely serve as the catalyst for the next leg up, providing the necessary liquidity to fill large buy orders.
Primary Interest Zone ($6,700 - $6,74: This marked demand block aligns with a "Discount" pricing array. This is the first high-probability area where institutional accumulation is expected to resume.
Extreme Discount/HTF Support ($6,520 - $6,55: This lower boundary serves as the "line in the sand" for the current bullish structure. Maintaining this level is vital for the long-term integrity of the uptrend.
3. Momentum & Volume Distribution Analysis
Williams %R: Currently hovering in the neutral territory (−48.11), confirming the lack of immediate directional conviction. A dip into the oversold region (below −8 followed by a sharp recovery would be a classic trigger for a long entry.
Accumulation/Distribution (A/D): The curve remains resilient at 195.75B. The lack of a sharp divergence suggests that while the price is stalling, major players are not aggressively offloading positions, supporting a "buy-the-dip" thesis.
4. Institutional Executive Summary
Market Bias: Neutral-Bullish. While the macro tre