Palladium: A Market Without Liquidity
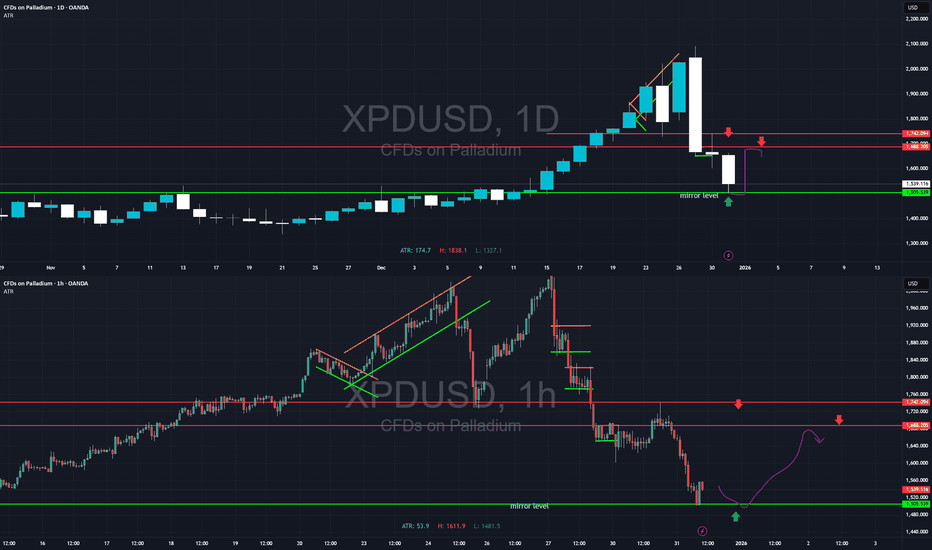
The current move from 2100 - 1550 on the daily chart (D1) is not a random sell-off and not a “market error.” It is the result of three overlapping factors that strongly reinforce each other in palladium:
Year-end profit taking
Liquidity compression. In the pre-holiday period—especially on December 31—large players (banks, market makers) are largely inactive. The order book lacks real buy orders. Any sizable sell order can push the price down by tens of dollars simply because there is no one to absorb the volume.
Fundamentals set the direction, speculation set the amplitude, liquidity set the speed.
Technical “margin call cascade.” The prior rally was parabolic. In such trends, long stops are placed very tightly. Once profit taking triggered the initial drop, a chain of stop-losses was hit. These stops automatically turned into market sell orders, accelerating the decline in an avalanche-like move.
What usually happens next?
Palladium is an industrial metal. In January, automakers often sign new supply contracts.
After declines of 25–30%, palladium almost never forms a V-shaped reversal unless:
there is an acute physical deficit, or
a new fundamental driver emerges.
Typical post-crash palladium scenario
The current case is structurally closer to 2021–2024.
Historical rebound zones (from the 2100 → 1500 decline):
~1650–1700 — the most likely first bounce
~1680–1750 — the key retracement zone
Historically, moves above a 50% retracement do not occur and do not hold without a new fundamental catalyst.
Short bias: looking for shorts around 1700 or 1750.
Long bias: tactical longs near 1500.
Based on palladium’s history, a second bottom should be expected.
The second bottom is most often:
equal to the first, or
slightly lower (a fals