BTCUSDT Fake Breakdown Sparks Bounce from Demand
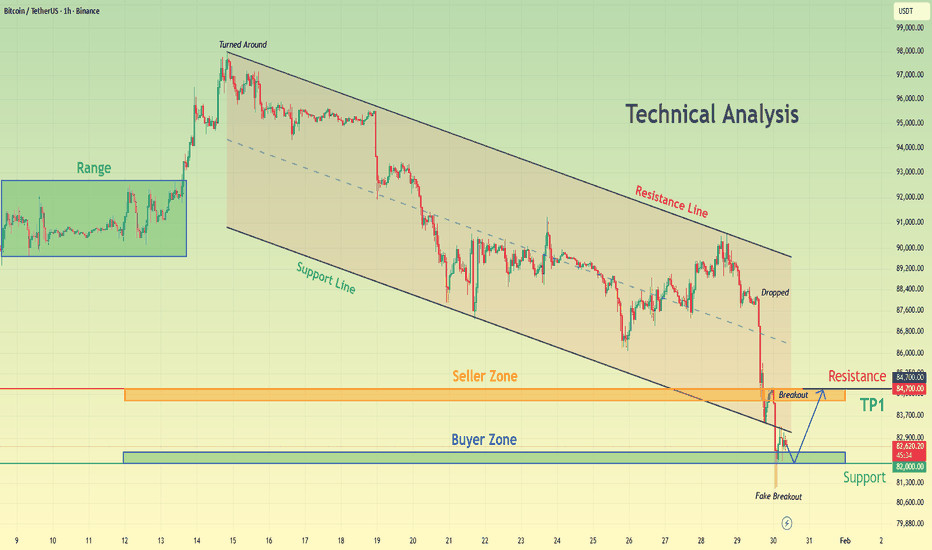
Hello traders! Here’s my technical outlook on BTCUSDT (1H) based on the current chart structure. Bitcoin initially traded within a clearly defined range, where price moved sideways, indicating temporary balance and accumulation before the next directional move. This range eventually resolved to the upside, triggering a strong bullish impulse that pushed price sharply higher. However, this breakout failed to sustain, and BTC quickly turned around from the highs, signaling exhaustion of buyers and the start of a corrective phase. After the rejection, price transitioned into a well-defined descending channel, where it consistently respected the falling resistance line and internal support, forming a sequence of lower highs and lower lows. This structure clearly confirmed short-term bearish control. Currently, BTC is holding above the reclaimed support and stabilizing after the fake breakdown, indicating acceptance above the Buyer Zone. This behavior often precedes a corrective recovery rather than an immediate trend reversal. From a structural perspective, the area around 84,700 acts as the next Resistance / Seller Zone, which aligns with previous support turned resistance and represents a logical upside target. My scenario: as long as BTCUSDT holds above the Buyer Zone around 82,000 and continues to respect this reclaimed support, a corrective move toward the 84,700 resistance area (TP1) remains likely. This would represent a healthy pullback recovery within a broader bearish structure. However, a strong rejection from resistance could resume downside pressure, while a decisive breakdown back below the Buyer Zone would invalidate the recovery scenario and signal continuation of the downtrend. For now, price is at a key reaction zone, with buyers attempting to confirm th