XPD/USD | Institutional Support Defines Bullish Bias
🔥 XPD/USD — Palladium vs U.S. Dollar 💎
⚡ Metals Market Opportunity Blueprint | Day / Swing Trade 🚀
📊 MARKET SNAPSHOT (Jan 2, 2026)
💵 Live Price: 1,613.40 USD/oz
📈 52-Week Range: 885.83 → 2,014.01
🏆 YTD Performance: +86.56% (strongest rally in ~15 years)
📊 Technical Bias: Neutral → Bullish Potential
🎯 TRADE BIAS
📌 Primary Plan: BULLISH PULLBACK
Double pullback confirmed on 200 SMA retest
Higher-timeframe structure remains bullish
Consolidation completed → momentum re-ignition
Buyers defending structure after corrective phases
🧠 Market Context:
Structural supply deficit expected into 2027
Slower EV adoption = extended ICE demand
Russian supply constraints maintain scarcity premium
💰 ENTRY STRATEGY — THIEF LAYERING METHOD
Accumulation on pullbacks | No single-price exposure
🕵️♂️ BUY LIMIT LAYERS
🟢 Layer 1: 1,500 → ~33% position
Psychological + structural support
🟢 Layer 2: 1,550 → ~33% position
Mid-range pullback & cost-average zone
🟢 Layer 3: 1,600 → ~34% position
Resistance flipped to support
💡 Why Layering Works:
Reduces average entry price
Protects against fake breakouts
Builds exposure where institutions accumulate
📌 Adjust spacing based on volatility & risk profile
🛑 STOP LOSS FRAMEWORK
❌ Invalidation Level: 1,450
📉 Breakdown below this level:
Breaks macro support
Invalidates bullish structure
Signals higher-timeframe momentum shift
⚠️ This SL is structural reference — adjust to your own risk rules
🎁 PROFIT OBJECTIVES — LIQUIDITY ZONES
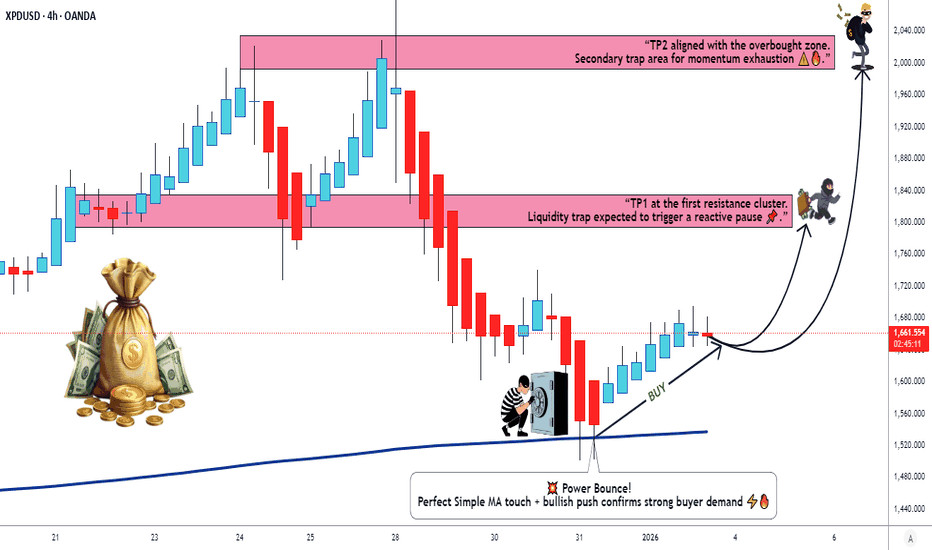
🎯 TP1: 1,800 — Liquidity Cluster
Historical volume concentration
Expect reaction / pause
📌 Action: Book 40–50% profit
Move SL toward breakeven / above Layer 2
⚡ TP2: 2,000 — Overbought Zone
Higher-TF exhaustion ar