Mean Reversion in Action | Intraday Structure & Market Mechanics
Short-term market moves often appear chaotic, but beneath the surface, price frequently follows statistical and structural tendencies — one of the most important being mean reversion.
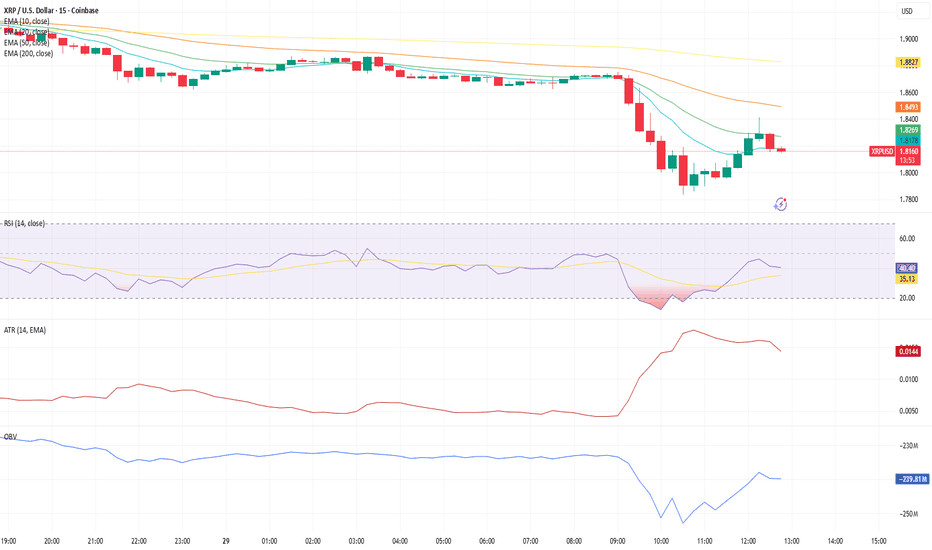
This chart provides a clean real-time example of how price behavior stabilizes following volatility expansion.
What Is Mean Reversion?
Mean reversion describes the tendency for price to return toward its short- and medium-term averages after extended deviation.
Rather than forecasting direction, this framework focuses on understanding market mechanics — specifically:
Volatility expansion
Distance from trend EMAs
Momentum exhaustion
Structural re-balancing
What We Observe Here
Following aggressive downside momentum:
Price extended significantly below key short-term EMAs
Volatility expanded rapidly
Momentum reached short-term exhaustion levels
Mean distance became statistically stretched
As a result, price began reverting back toward its structural equilibrium zone.
This process reflects mechanical market behavior, not predictive bias.
Why This Matters
Mean reversion is one of the most important principles for understanding:
Intraday stabilization
Volatility compression
Structural resets
Trend sustainability
Rather than attempting to predict bottoms or tops, observing how price behaves around its structural means offers clearer insight into market condition and participation.
Final Structural Note
When markets experience rapid deviation, reversion toward trend averages is a natural response — especially when volatility becomes extended.
This does not imply directional certainty.
It simply demonstrates how markets normalize after imbalance.