ETHUSD (3H chart pattern ).
structure-based take.
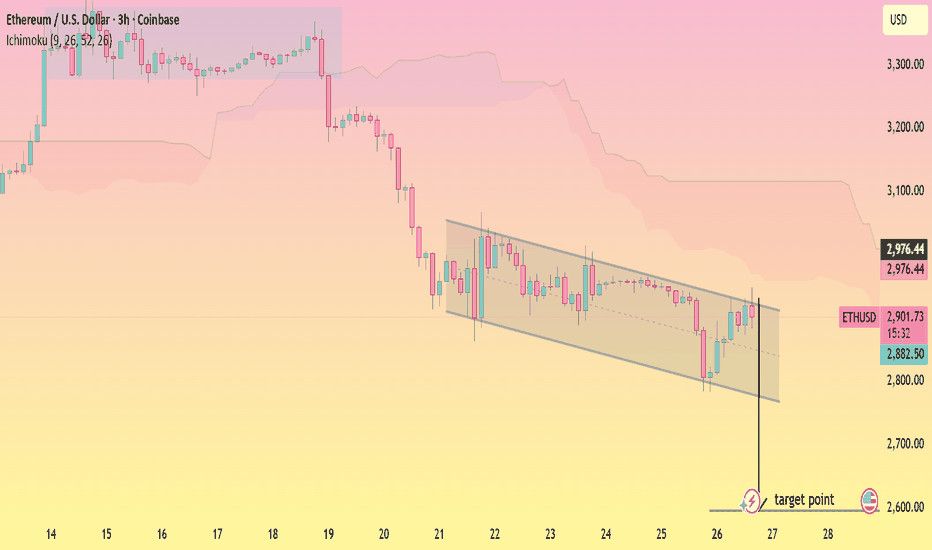
What the chart shows
Strong impulsive drop → then a bearish descending channel (flag)
Price is below the Ichimoku cloud → bearish bias
Me’ve marked a breakdown attempt near the lower channel
This looks like a bear flag continuation, not a reversal
🎯 Downside Targets
🎯 Target 1 (near-term)
≈ 2,880 – 2,850
Recent reaction lows
First liquidity/support zone
Good partial profit area
🎯 Target 2 (main target)
≈ 2,700 – 2,680
Measured move of the flag (pole → breakdown)
Strong horizontal support
Matches my marked “target point” area
🎯 Target 3 (extension, if momentum is strong)
≈ 2,600
Previous demand zone
Psychological level
❌ Invalidation
If price breaks and holds above ~3,000–3,020
Or cleanly reclaims the channel + cloud → bearish setup fails
Summary
TP1: 2,880–2,850
TP2: 2,700–2,680
TP3: 2,600 (optional extension)
If my want, I can:
Tighten this into a scalp vs swing plan
Help with stop-loss placement
Or flip it and give bullish targets if it breaks up 📈