FR40 Bullish Structure | Smart Pullbacks in Control
🔷 FR40 / CAC40 — FRANCE 40
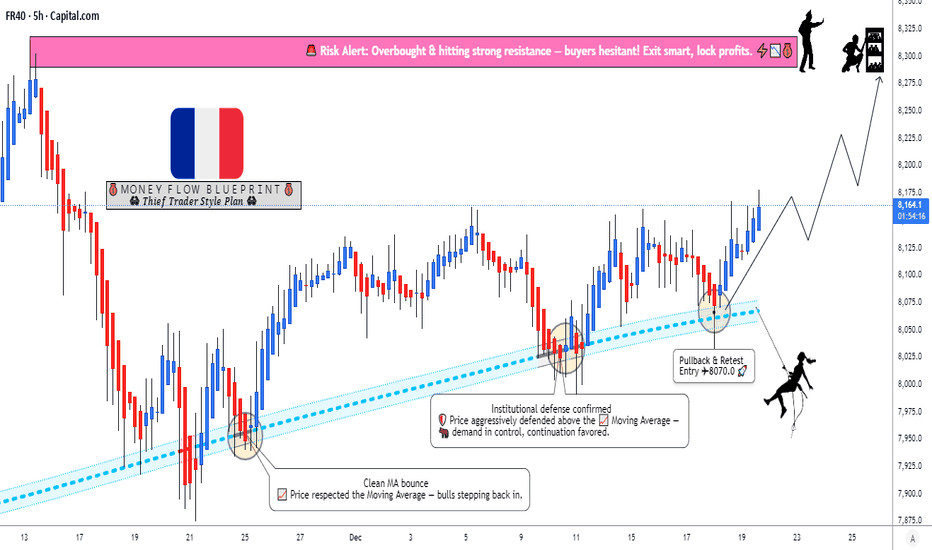
📊 Index Market Capital Flow Blueprint (Swing Trade)
🧭 Market Bias
🟢 Bullish Structure Confirmed
Price continues to respect the Triangular Moving Average (TMA) with multiple clean pullbacks, signaling sustained institutional accumulation and healthy trend continuation.
🧠 Trade Plan Logic
📐 Triangular Moving Average = Dynamic Support
Multiple pullback reactions 🧲
Higher-timeframe trend intact 📈
Momentum maintained above structure 🏗️
This behavior typically reflects smart-money re-entries, not retail chasing.
🎯 Entry Strategy (Layered Execution)
🔹 Entry Style: Any price level (Layered accumulation approach)
🧱 Buy Limit Layers (Example):
8070
8100
8125
8150
📌 You may increase or adjust layers based on your own execution model.
🛑 Risk Management
🔻 Stop Loss: 8000
⚠️ This is a reference level, not a mandate.
Always align risk with your capital, timeframe, and psychology.
🎯 Target Zone
🚨 8300 Area
Strong resistance cluster 🧱
Overbought conditions ⚠️
Trap & correction probability increases 📉
💡 Recommendation: Scale out profits — do not overstay.
📝 Important Note
🔔 This plan is not financial advice.
Every trader must manage entries, SL, and TP independently based on their own risk framework.
🔍 Related Markets to Watch (Correlation Guide)
🇺🇸 US30 ( TVCJI )
Strong positive correlation with FR40
Risk-on flows into US equities often spill into European indices
🇩🇪 GER40 ( XETRAX )
Closest structural correlation
German industrial strength frequently leads CAC40 direction
🇺🇸 SPX500 ( SP:SPX )
Global risk sentiment benchmark
Sustained SPX strength supports European index continuation
🇺🇸 EUR/USD ( FX:EURUSD )
Rising EUR can cap upside in FR40