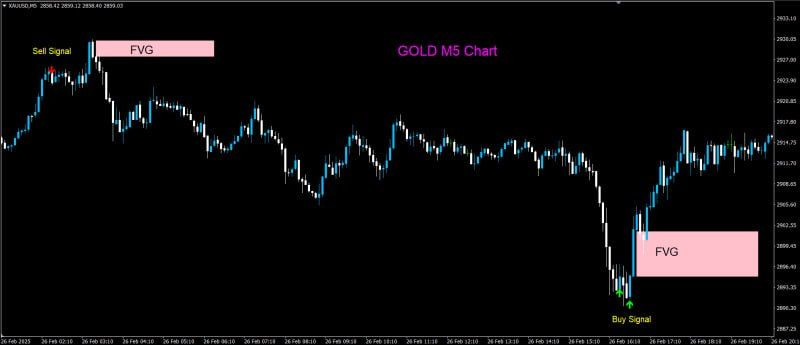
🌐 Indicator RSI Buy/Sell Arrows with FVG Confluence Indicator 👑
This indicator combines RSI-based signals with price action analysis. It plots buy (↑) and sell (↓) arrows directly on the main price chart when:
➡️ Buy Signal: RSI crosses upward through the 20 level (oversold)
➡️ Sell Signal: RSI crosses downward through the 80 level (overbought)
➡️ After an arrow appears, wait for a Fair Value Gap (FVG) on the price chart.
➡️ Enter trades only at the FVG zone that aligns with the arrow’s direction.
✅ Example: For a buy arrow, look for a bullish FVG (downside gap) to retrace and fill before entering long.
टिप्पणी
शेयर करना


