Cotton Short Opportunity! Strong Structure + Clear Downside Path
🌾 COTTON (CTMUSD) vs USD - BEARISH SWING TRADE 📉
💼 Professional Market Opportunity Analysis
📊 TRADE SETUP OVERVIEW
Asset: Cotton Futures (CTMUSD) | Commodity CFD
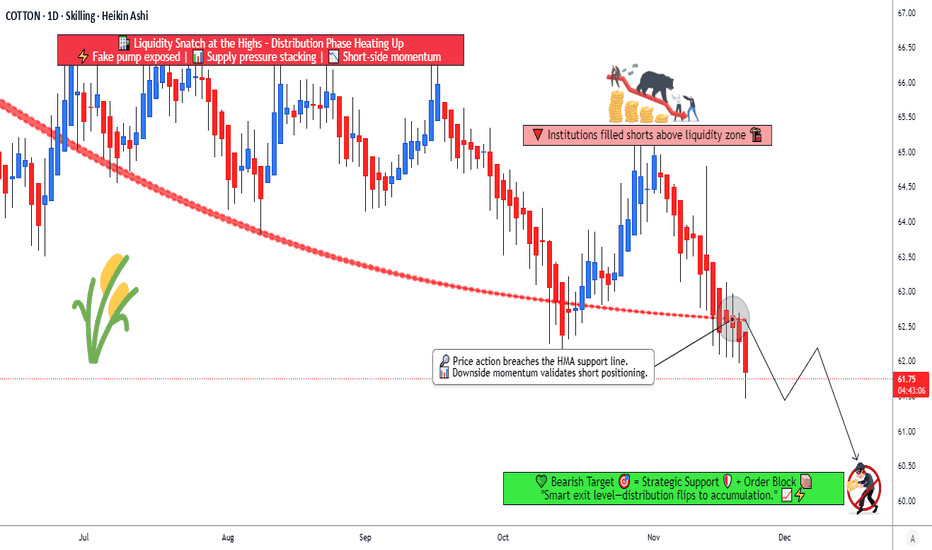
Market Bias: BEARISH ⬇️
Timeframe: Swing Trade (2-5 days)
Signal: Hull Moving Average Breakout Confirmation ✓
🎯 ENTRY STRATEGY - "LAYERING METHOD" 📍
Using multiple limit orders to achieve optimal entry positioning:
Suggested Entry Layers:
Layer 1: 63.00 (Initial Entry)
Layer 2: 62.50 (Second Position)
Layer 3: 62.00 (Third Position)
💡 Pro Tip: Adjust layer density based on your position size & risk tolerance
🛑 RISK MANAGEMENT
Stop Loss: 64.00
⚠️ Important: This is a suggested level. Adjust your SL based on your personal risk strategy and account management preferences.
Your Choice = Your Control | Make informed decisions based on YOUR risk profile.
🎁 PROFIT TARGETS
Primary Target: 60.50
Rationale: Strong support zone + oversold conditions + technical trap identification
⚠️ Important: This is a suggested level. Your TP is YOUR decision. Take profits at levels that match YOUR trading plan.
📈 TECHNICAL CONFLUENCE
✅ Hull Moving Average Breakout
✅ Oversold Zone Entry
✅ Support Level Confluence
✅ Risk/Reward Ratio Favorable (1:2+)
🔗 RELATED PAIRS TO MONITOR
USD Index ( TVCXY ) 💵
Correlation: Strong Negative (-0.85)
Why: Stronger USD typically pushes commodity prices lower. Monitor DXY for confirmation of bearish move.
Key Level: Watch 104.00-105.00 for USD strength
FX:EURUSD
Correlation: Moderate Inverse (-0.7
Why: EUR weakness = USD strength = Cotton selling pressure
Key Level: Break below 1.0850 supports bearish bias
Gold ( OANDA:XAUUSD ) 🟡
Correlation: Positive (0.65)
Why: Risk-off sentiment affects both. If gold falls, commodity selloff a