Gold Testing a Key EMA, the Pullback Remains Technical
On the OANDA:XAUUSD H1 chart, gold is entering a short-term corrective phase following the previous strong rally. The key point to emphasize is that the bullish structure remains intact, and current price action is mainly about how the market reacts around the major EMA levels.
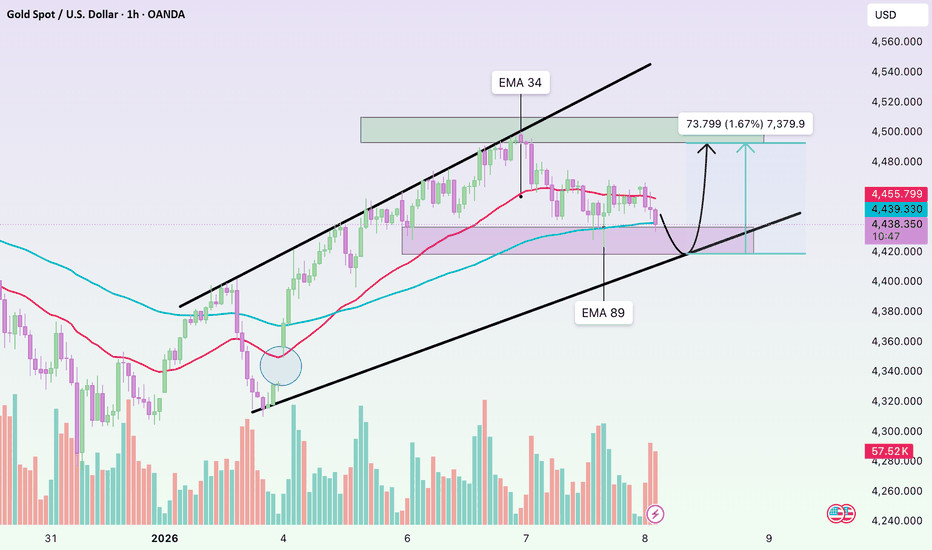
From a technical perspective, price is hovering around the EMA 89, corresponding to the 4,4354,440 zone. Meanwhile, the EMA 34 sits higher near 4,455 and has temporarily turned into a short-term dynamic resistance. Price failing to hold the faster EMA and pulling back toward the slower one is a familiar scenario within a healthy uptrend, where larger players closely observe price reactions to assess whether the trend continues to be defended.
The constructive sign so far is that gold has not printed a clear H1 close below the EMA 89 . The corrective candles remain relatively small and show lower wicks, suggesting that selling pressure is still limited. Although volume has ticked up slightly during some of the pullback legs, there is no evidence of aggressive distribution or heavy unloading.
Overall, this decline is better interpreted as a pullback toward a balance zone after price had extended significantly away from the EMAs during the prior advance. Given golds volatility characteristics, such corrections often serve to relieve pressure and rebuild a base before the market decides on its next directional move.