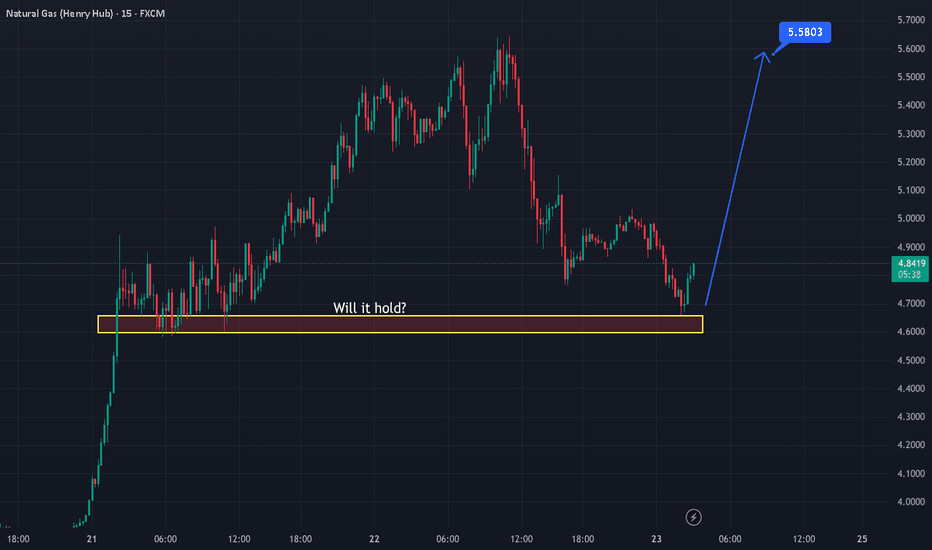
Natural Gas Ready to Extend
Old resistance is now being tested as support.
If it holds, price can push toward 4.15.
Comment
Share


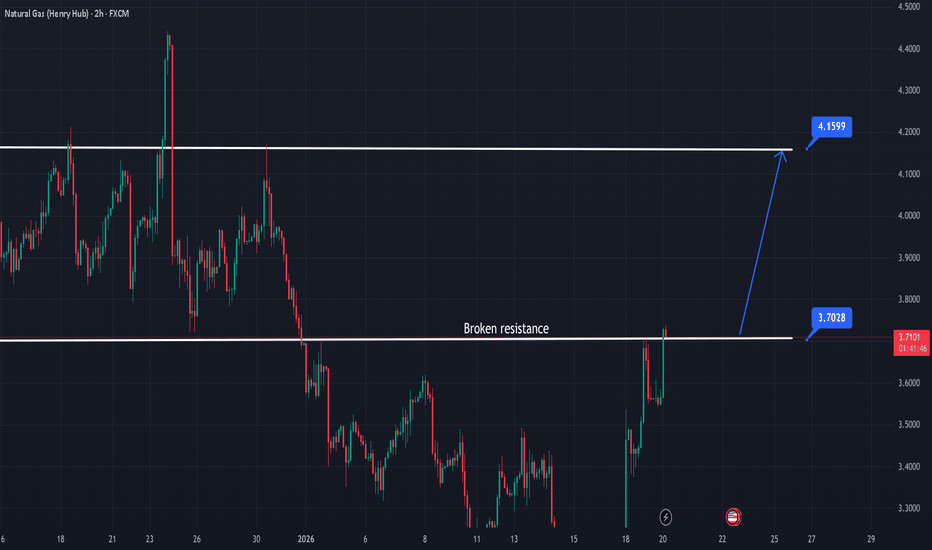
Natural Gas Ready to Extend
Old resistance is now being tested as support.
If it holds, price can push toward 4.15.
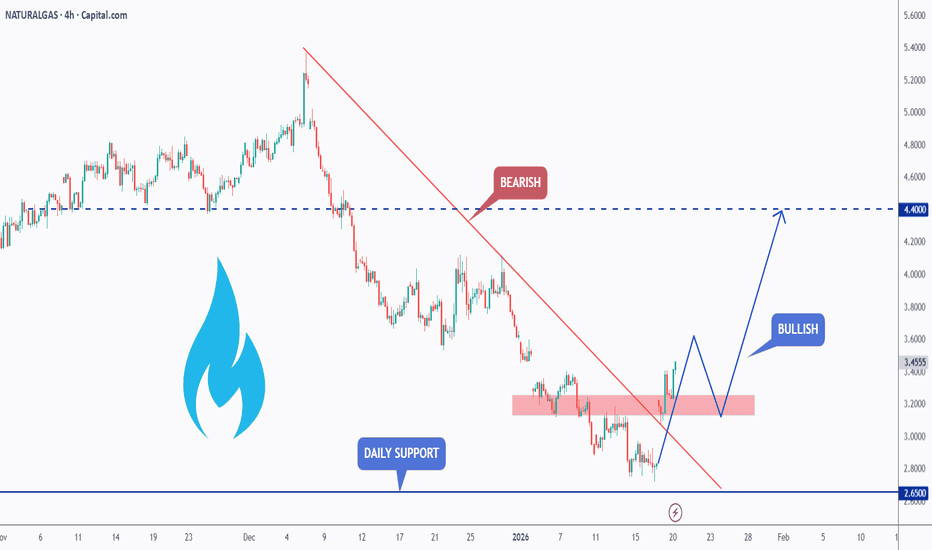
Natural Gas – Trend Shift in Progress?
After being bearish bearish for a while, Natural Gas has broken out of the descending red trendline, signaling a clear shift in momentum from bearish to bullish.
What stands out here is how price reacted after the breakout. Instead of selling off again, it held above the recent support zone and started building higher structure.
As long as this new bullish structure holds, the bias remains to the upside, with room for continuation toward higher levels. Any pullbacks that stay above support are, for me, opportunities to watch.
⚠️ Disclaimer: This is not financial advice. Always do your own research and manage risk properly.
📚 Stick to your trading plan regarding entries, risk, and management.
Good luck! 🍀
All Strategies Are Good; If Managed Properly!
~Richard Nasr
Natural Gas - Supply Fears?
Natural Gas had one of the largest moves i have ever seen in one day.
Fear has spread into the nat gas market on supply fears since tensions have been rising around NATO / USA / EU....
With tarrifs being threatened one area that the EU remains vulnerable is their energy consumption.
We closed our AMEX:UNG calls today for over 900% locking in extraordinary gains...
We sold our AMEX:BOIL for 31% gain...
Nat Gas equities remain interesting and still a buy if this price holds / consolidates.
Natural Gas Prices Surge as Cold Weather Approaches
According to AccuWeather, a powerful Arctic cold front is expected to sweep across the United States, reaching as far south as the southern states and bringing lower temperatures to more than 150 million people across 24 states.
On Thursday, Texas Governor Abbott declared a state of emergency in more than half of the state’s counties ahead of the cold snap. It is worth noting that Texas is home to key natural gas production facilities, while its infrastructure is less adapted to prolonged cold weather.
As a result, market sentiment is being shaped both by expectations of higher natural gas demand for heating and by the risk of technical disruptions to production.
Consequently, the XNG/USD chart shows a sharp rise in natural gas prices, with the move from last week’s low to the recent high amounting to nearly 40%.
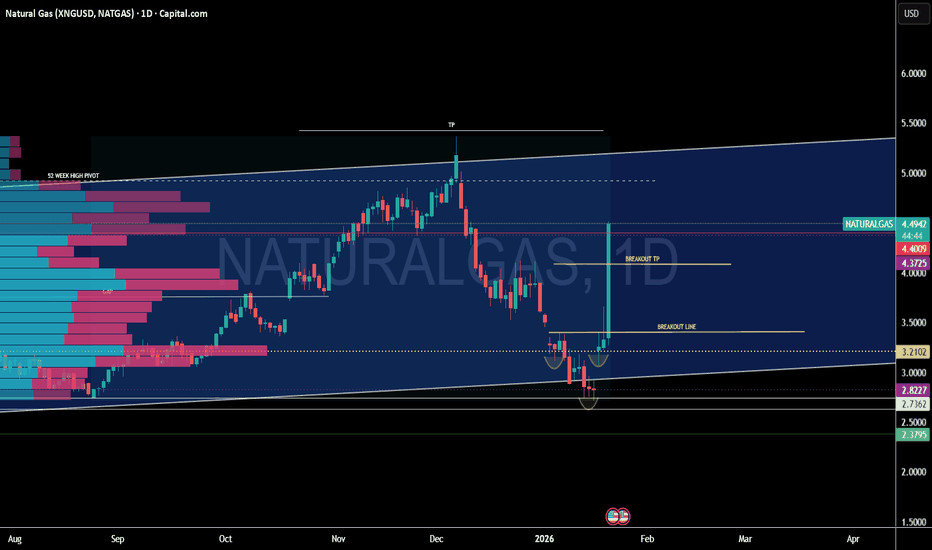
Technical Analysis of the XNG/USD Chart
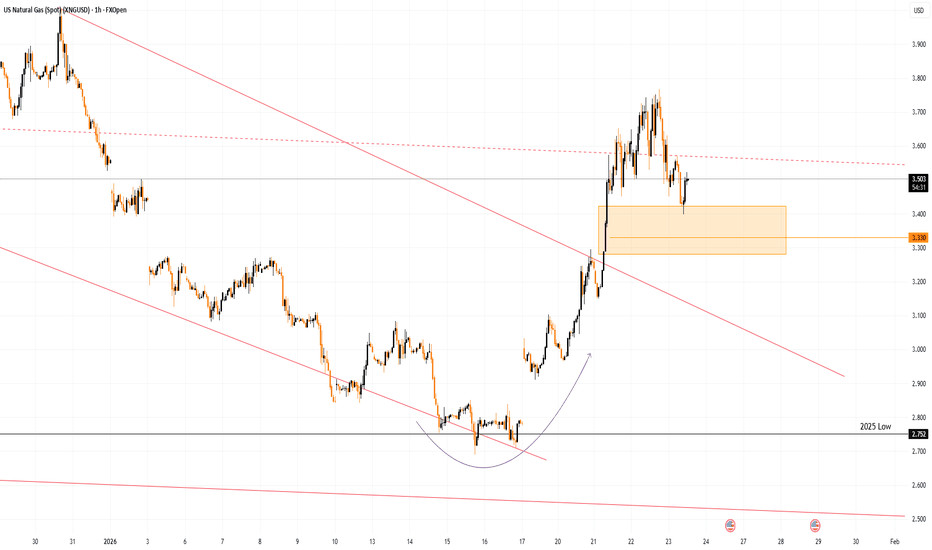
When analysing gas prices on 15 January, we identified a long-term descending channel, highlighted in red on the chart. At that time, we also:
→ noted that prices were hovering near the 2025 low;
→ suggested that bears might attempt to break below the 2025 low, which could have a psychological impact on the market, prompting short sellers to take profits and encouraging renewed buying interest.
Indeed, following a false bearish break of the 2025 low (as indicated by the arrow), prices surged sharply towards the median of the channel, an area where supply and demand often tend to balance.
Moreover, around the 3.330 level, there was a clear period of imbalance in favour of buyers. Bulls broke through the descending trendline resistance, and XNG/USD rose with minimal pullbacks.
From a technical perspective, it is therefore possible that this area may
Natural Gas Market at a decision point
Our last trade on this pair
Price pulled back after a strong move and is now sitting in an area where buying showed up before.
Selling has slowed down, and price is no longer pushing lower with strength.
If this area holds, price has room to work higher toward the next upside zone.
If it fails, downside pressure stays in play.