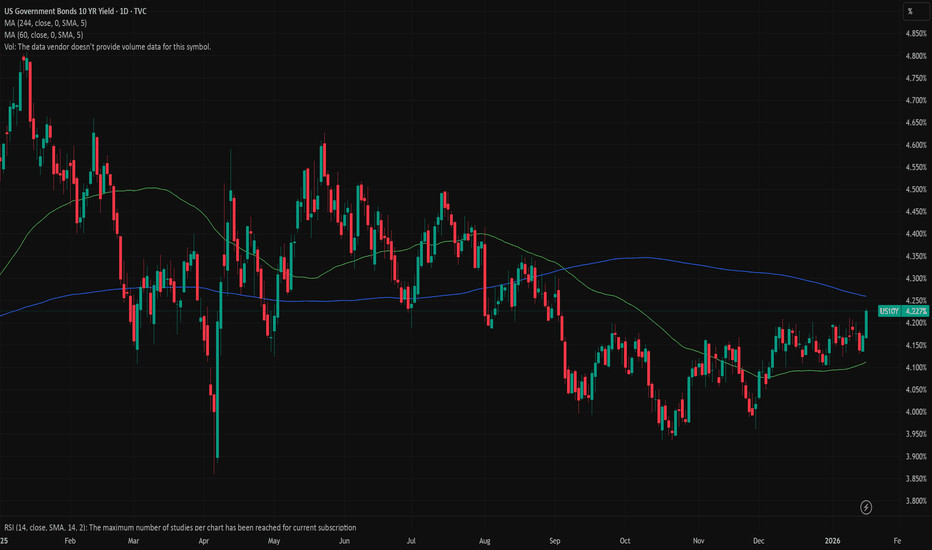


US 10‑Year Yield: Quiet… but waking up?
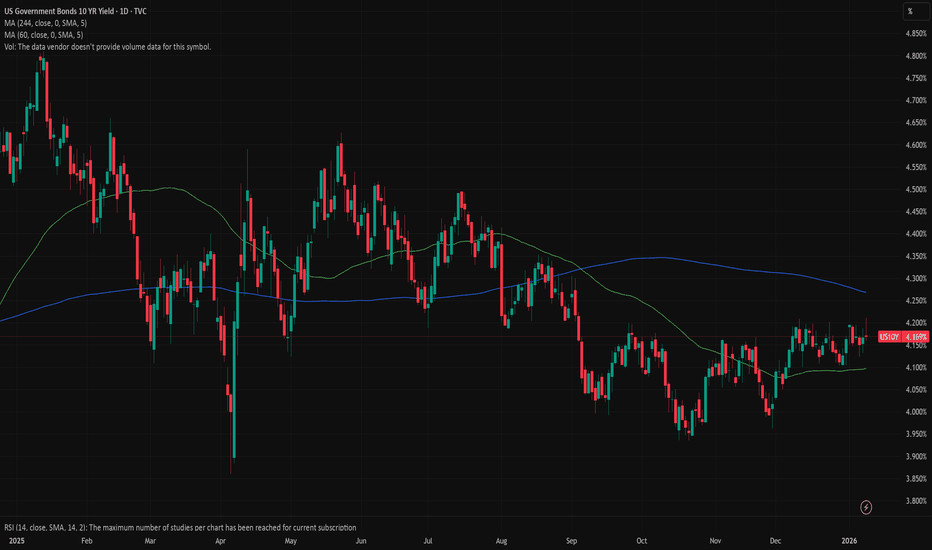
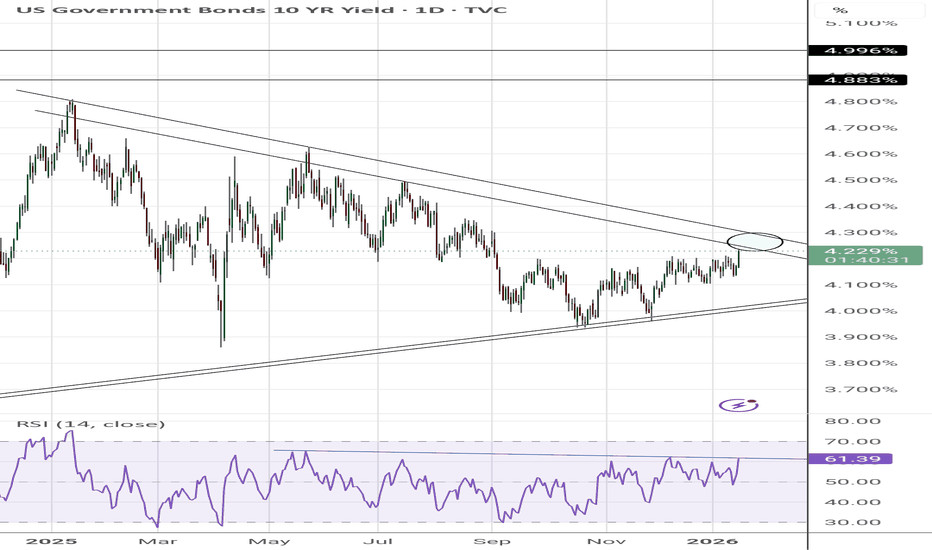
The range may look dull, but there are signs of life. The 10‑year has broken above its short‑term downtrend from June, yet it’s still capped by the September high at 4.20% and the 200‑day MA around 4.23%.
Price has now pushed above the Ichimoku cloud, with the lagging line following — a subtle but meaningful shift ahead of NFP and rising geopolitical tensions.
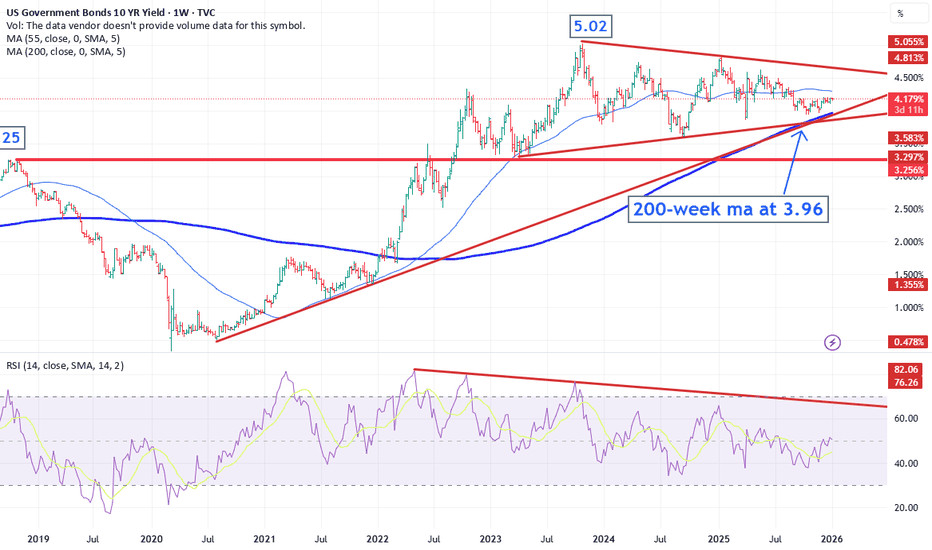
On the weekly chart, strong support from the 2020 uptrend and the 200‑week MA at 3.96% keeps the structure intact. A break above 4.24% could open the path toward the long‑term channel top near 4.61%.
One to keep firmly on the radar.
Disclaimer:
The information posted on Trading View is for informative purposes and is not intended to constitute advice in any form, including but not limited to investment, accounting, tax, legal or regulatory advice. The information therefore has no regard to the specific investment objectives, financial situation or particular needs of any specific recipient. Opinions expressed are our current opinions as of the date appearing on Trading View only. All illustrations, forecasts or hypothetical data are for illustrative purposes only. The Society of Technical Analysts Ltd does not make representation that the information provided is appropriate for use in all jurisdictions or by all Investors or other potential Investors. Parties are therefore responsible for compliance with applicable local laws and regulations. The Society of Technical Analysts will not be held liable for any loss or damage resulting directly or indirectly from the use of any information on this site.