Silver’s Generational Super Cycle: 31 Years of Waiting, 15 Years
Welcome to a special macro edition of the Mubite market analysis.
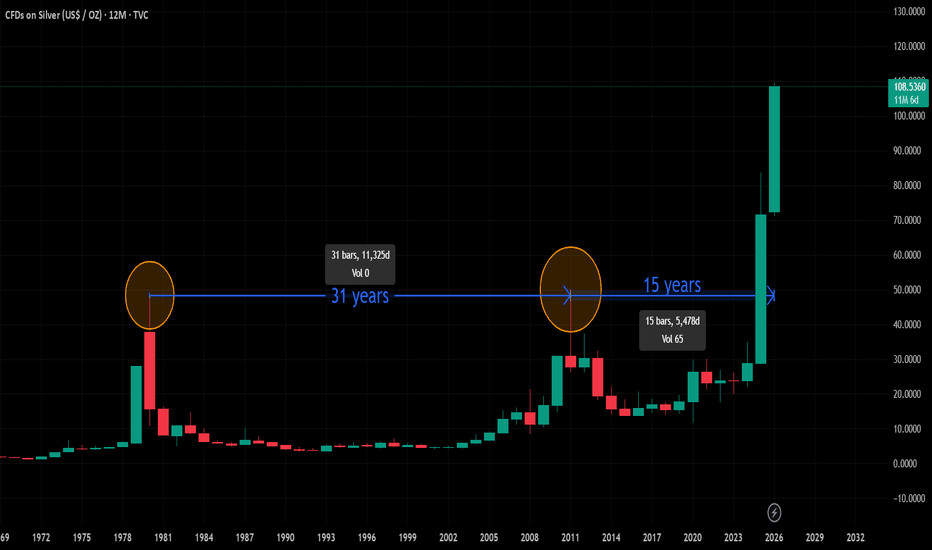
Today, we are zooming out to the 12-Month (Yearly) timeframe on Silver (XAG/USD).
In trading, patience is not just a virtue; it is a requirement for generational wealth. The chart we are looking at today tells a story of massive cycles, decades of consolidation, and the explosive payout that follows.
The Technical Story: The Cycle of Patience
As marked on the chart, Silver moves in massive waves. It doesn't just trend; it hibernates, and then it erupts.
1. The 1980 Peak ($48.0 This was the historic high driven by the Hunt Brothers. After this vertical move, the market entered a deep "winter."
The Wait: It took exactly 31 Years for price to return to this level.
2. The 2011 Peak ($49.83) In 2011, history rhymed. Silver revisited the $50 region, forming a massive "Double Top" on the generational chart. Once again, it was rejected.
The Accumulation: This time, the winter was shorter. It took 15 Years of consolidation (half the time of the previous cycle) to build enough energy to break through.
3. The 2026 Breakout ($108+) We are now living through history. The resistance that held for 46 years (1980-2026) has been shattered.
Current Status: Silver is in "Price Discovery," trading above $108. The ceiling of the last two generations has become the floor.
The Golden Rule: "The Trend is Your Friend"
When a commodity breaks a multi-decade resistance, it signals a fundamental shift in the asset's value. The energy stored during that 15-year consolidation is now being released.
...Until It’s Not
However, looking at the yearly candles of 1980 and 2011, we see that when the music stops, it stops abruptly.
The Warning: Vertical moves on a yearly timeframe eventually face mean reversion.
The Strate