Market Pressure (Part 5) | Multi-Timeframe Selling Alignment
Price structure is currently reflecting strong and aligned selling pressure across multiple timeframes.
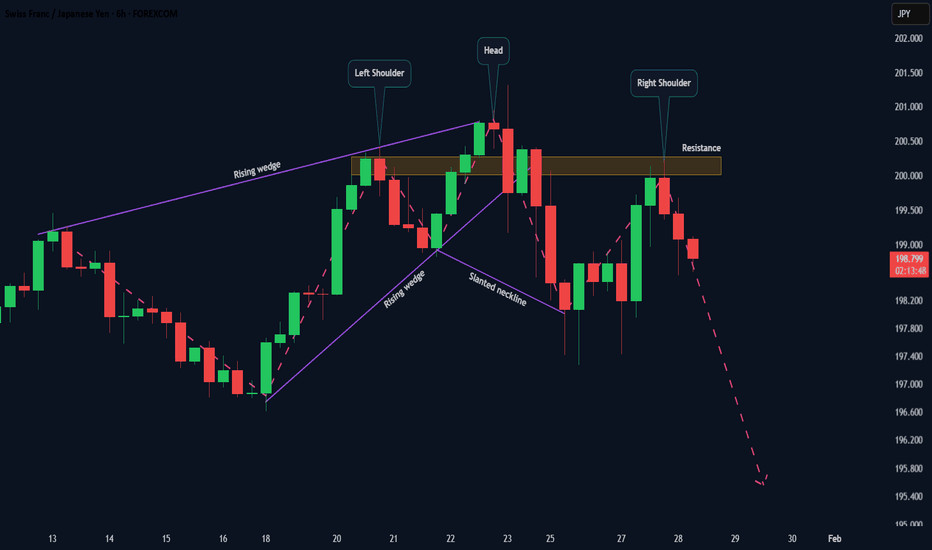
On the 6H chart , price previously formed a rising wedge , followed by a developing Head and Shoulders structure with a slanted neckline .
Price has now reacted at the left shoulder resistance , which may mark the early formation of the right shoulder .
This reaction is supported by:
shrinking candles
a clear bearish engulfing candle
rejection from a well-defined resistance zone
On the Daily chart , price has also reacted from an ascending trendline acting as resistance, adding higher-timeframe confirmation.
On the 30-minute chart , a Head and Shoulders breakdown is already visible, reinforcing the broader bearish narrative.
📉 Primary Observation – Selling Pressure Alignment
Selling pressure is currently aligned across:
Daily timeframe
6H structure
30-minute execution context
This alignment suggests controlled downside participation rather than random volatility.
⚠️ Pressure Reassessment
If price breaks and sustains above the current resistance and invalidates the right-shoulder structure, selling pressure would weaken and the structure would require reassessment.
🧠 Key Insight
Patterns do not move price.
Pressure alignment across timeframes does.
⚠️ Educational & Analytical Use Only
This analysis is shared strictly for educational and analytical purposes.
No financial advice, trade signals, or guarantees are provided.
All decisions remain the sole responsibility of the reader and should align with their own ethical, legal, and religious principles.