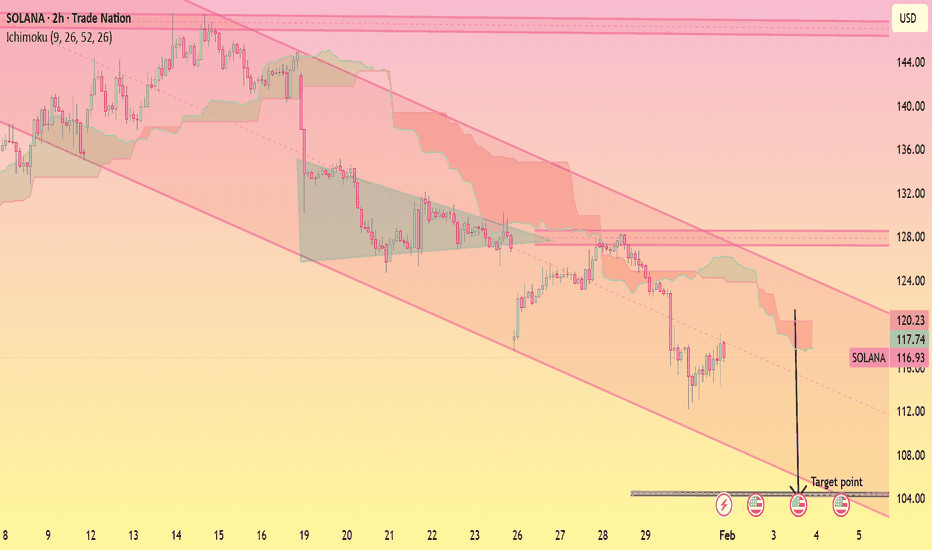
SOL Breakdown in Bearish Channel
This 2-hour SOL/USD chart with Ichimoku Cloud shows a sustained downtrend inside a descending channel. After topping near the upper resistance, price rolled over, lost cloud support, and formed a bearish consolidation before breaking lower. SOL continues to trade below key resistance around 128–130, with the cloud acting as overhead pressure. The projected downside target sits near 104, signaling bearish continuation unless price reclaims the channel and cloud.
Comment
Share


