SP500 Showing Rejection Pattern what should Next ?
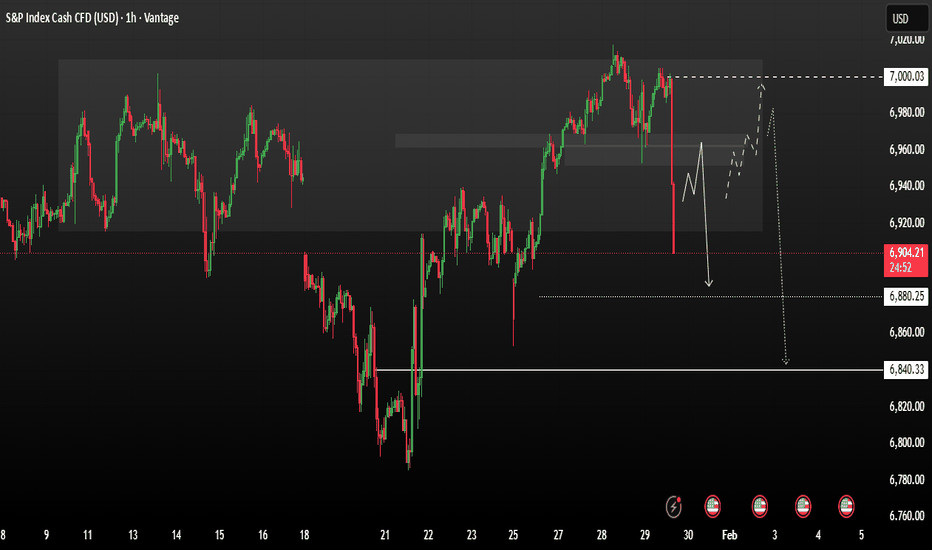
S&P 500 showing rejection from the 7,000 psychological resistance zone after a strong bullish rally. Price failed to hold above this level and formed a sharp bearish candle, signalling selling pressure and possible short-term trend exhaustion.
area marks a supply/resistance zone where sellers are active. As long as price stays below 7,000, further downside correction is likely. A minor pullback and consolidation may occur first, but continuation lower remains the stronger scenario.
Resistance Level ; 69,50 / 7,000
Support Levels ; 6,80 / 6,840
If 6,880 breaks, price could accelerate toward 6,840, which is the next strong demand area. Only a clean break and hold above 7,000 would invalidate the bearish outlook and open the path for continuation higher.
You may find more details in the chart,
Trade wisely best of Luck Buddies.
Ps; Support with like and comments for better analysis Thanks For Supporting.