USD/MXN Extends Downtrend as Key Support Breaks
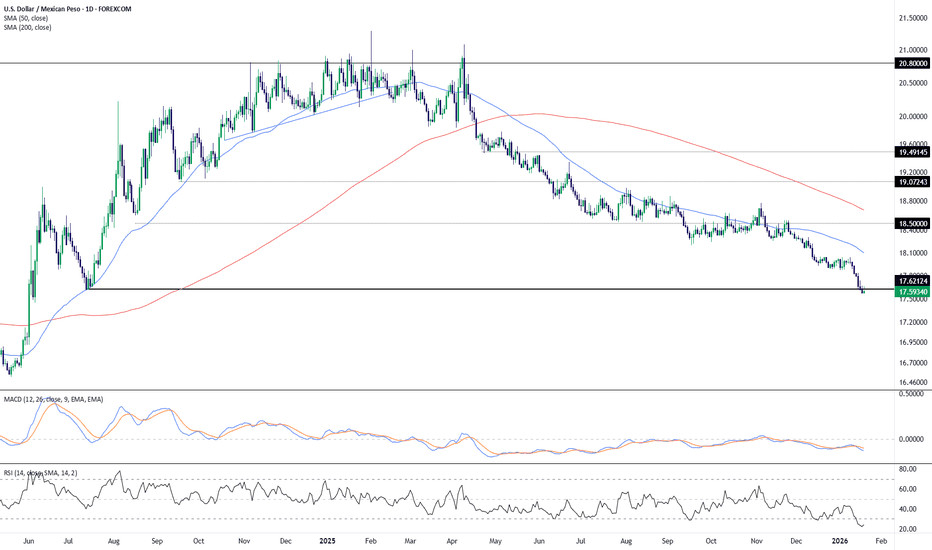
The daily chart of USD/MXN highlights a persistent bearish trend, with price recently breaking below the 17.62 support zone, marking a fresh multi-month low. This move reinforces the dominant downside momentum that has been in place since early 2025.
Key Technical Observations:
Moving Averages:
The 50-day SMA (blue) at 18.09 and the 200-day SMA (red) at 18.67 are both sloping downward, confirming a strong bearish bias. Price remains well below these averages, signaling sustained selling pressure.
Momentum Indicators:
MACD: The MACD line is deeply below the signal line, with both in negative territory, indicating strong bearish momentum.
RSI: Currently at 24.67, the RSI is in oversold territory, suggesting the pair may be vulnerable to a short-term corrective bounce, though the broader trend remains bearish.
Price Structure:
After consolidating near 18.50 earlier in the year, USD/MXN accelerated lower, breaking successive support levels. The latest breach of 17.62 opens the door for potential continuation toward the next psychological level near 17.30.
Summary:
USD/MXN is entrenched in a strong downtrend, supported by bearish moving averages and momentum indicators. While oversold conditions could trigger a temporary rebound, the overall technical picture favors continued weakness unless price reclaims key resistance levels.
-MW