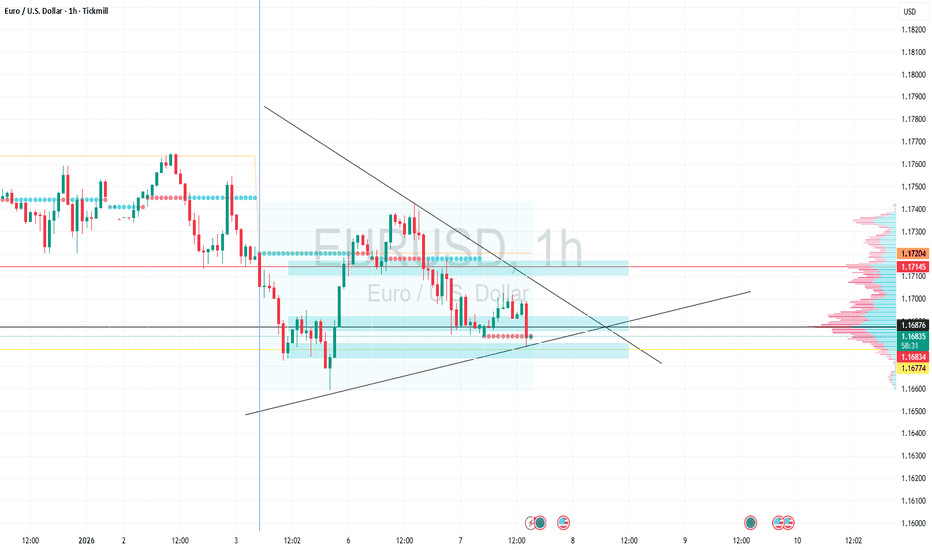
EUR/USD CHART QUICK ANALYSIS IN LONDON SESSION I 01/07
1. Market Structure & Trend
Main Trend: The market is currently in a consolidation (sideways) phase following a previous sharp decline. Price is compressing inside a Symmetrical Triangle pattern, defined by the two converging trendlines.
Current Price Action: The price is trading around 1.16838, sitting right on the lower support trendline and near the POC (Point of Control) of the Volume Profile.
2. Key Technical Levels
Resistance: * The zone between 1.17145 1.17204 (the upper blue box). This is the recent local high and aligns with the descending trendline.
Support: * The zone between 1.16774 1.16876. This is the immediate "hard" support. If a 1h candle closes decisively below 1.16700, the bearish trend is likely to resume.
3. Volume Profile Analysis
The Volume Profile on the right shows a massive concentration of trades at the current level (1.16800 1.1690. This indicates a "tug-of-war" between buyers and sellers. Once the price breaks out of this high-volume node, a volatile move is expected.
Trading Scenarios
Scenario 1 (Bearish Bias): If the price breaks below the triangles support and closes under 1.16770, the next target could be 1.16500 or lower.
Scenario 2 (Bullish Rebound): If a strong rejection (long wick) occurs at this support, the price may bounce toward the upper trendline near 1.17100. However, there is significant overhead resistance.
Pro Tip: Since the triangle is squeezing tightly, it is often safer to wait for a confirmed breakout and a retest before entering a position.