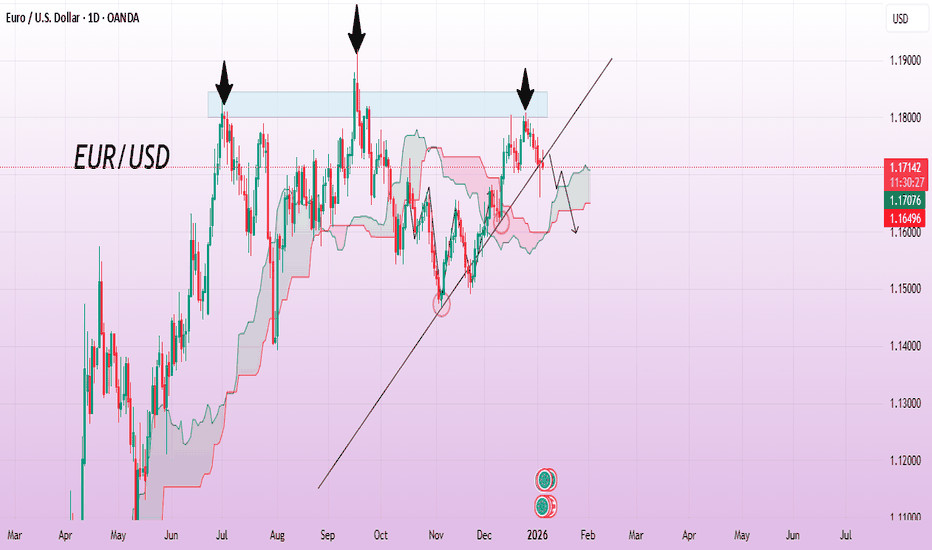
EUR/USD 1D CHART PATTERN
The EUR/USD daily chart shows price reacting strongly from a well-defined resistance zone, marked by multiple rejections in the highlighted supply area. These repeated failures to break higher suggest weakening bullish momentum and increasing selling pressure. Price has recently broken below the rising trendline that was supporting the previous upward structure, indicating a possible trend shift or deeper correction. The Ichimoku cloud reflects market indecision, with price hovering near the cloud and struggling to regain strong bullish control. This structure favors a cautious bearish outlook while below resistance. A sustained move downward could open the path toward the first support zone near 1.16744. If bearish momentum continues and sellers remain in control, the second downside objective around 1.15980 becomes likely. Risk management remains essential.
If you found this XAUUSD analysis helpful, dont forget to LIKE and COMMENT !