BTCUSDT Long: Uptrend Continues Toward 94,500 Resistance
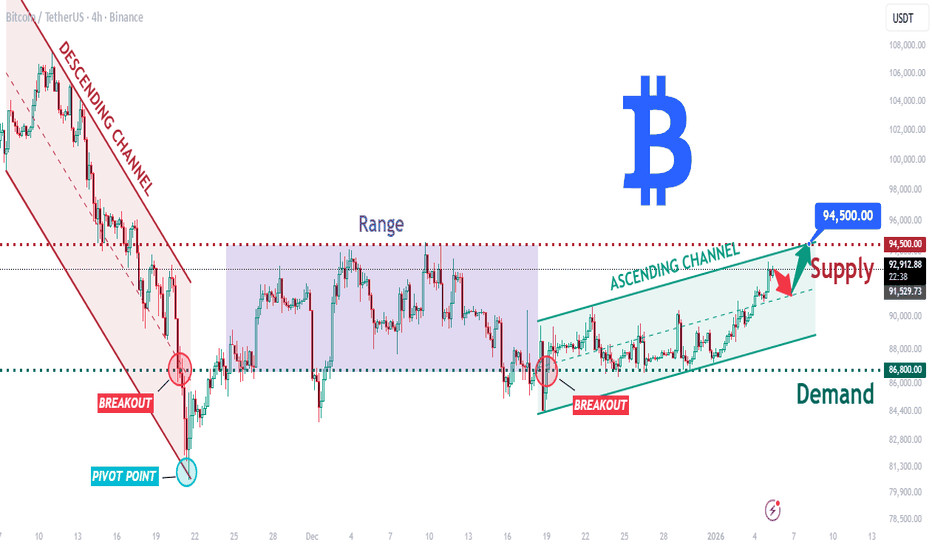
Hello traders! Heres a clear technical breakdown of BTCUSDT (4H) based on the current chart structure. BTCUSDT initially traded within a well-defined descending channel, reflecting sustained bearish pressure during that phase. This move ended with a clear pivot point, followed by a strong breakout from the descending channel, signaling a shift in market control from sellers to buyers. After this breakout, price transitioned into a broad range, where BTC consolidated for an extended period, showing balance between supply and demand with multiple internal reactions.
Currently, BTC is approaching a key Supply Zone around the 94,500 level, where previous selling pressure is expected to re-emerge. This area aligns with the upper boundary of the ascending channel, increasing the likelihood of a reaction. Below current price, the Demand Zone near 86,800 remains a critical support level, marking the prior breakout area and the base of the bullish structure.
My scenario: as long as BTCUSDT holds above the Demand Zone and stays within the ascending channel, the bullish bias remains intact. I expect price to test the 94,500 Supply Zone, where a reaction or short-term pullback may occur. A clean breakout and acceptance above supply would signal further upside continuation. However, a strong rejection from supply followed by a breakdown below channel support would suggest a deeper corrective move. For now, structure favors buyers while price remains within the ascending channel. Manage your risk!