EUR/USD) Bullish trend analysis Read The caption
SMC Trading point update
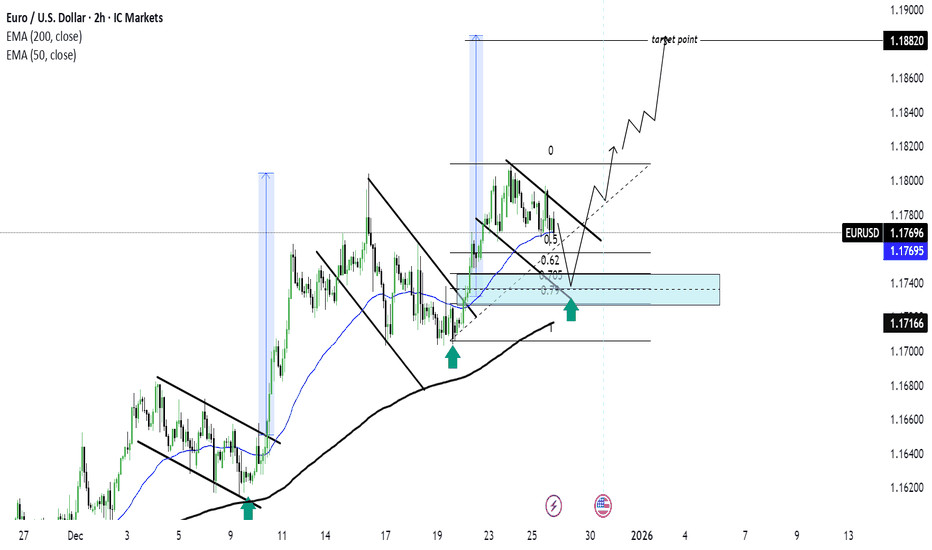
Technical analysis of EURUSD 2H chart using SMC + Fibonacci OTE + EMA trend continuation.
Market Context
Bias: Bullish continuation
Overall structure shows higher highs & higher lows
Strong impulsive move followed by healthy corrective channels
Price is holding above EMA 200, confirming HTF bullish bias
EMA 50 is acting as dynamic intraday support
What Price Is Doing
After a strong bullish displacement, price entered a descending corrective channel
That channel has now broken to the upside (bullish BOS)
Current pullback is a retest / re-accumulation, not weakness
This is classic trend correction continuation behavior.
Key Buy Zone (Blue Area)
~1.1735 1.1750
Why this zone is high-probability:
SMC demand / order block
Fib OTE zone (0.705 0.79)
EMA 50 + EMA 200 confluence
Previous resistance support flip
Multiple reactions already marked (green arrows)
This zone represents institutional rebalance, not retail buying.
Fibonacci Logic
Measured from the latest impulse low swing high:
0.5 / 0.62 = shallow pullback
0.705 0.79 = optimal trade entry (OTE)
Textbook continuation location in a bullish market
Trade Idea (Continuation Long)
Buy on confirmation inside demand
Entry: 1.1735 1.1750
Stop Loss: Below demand (~1.171
Targets:
TP1: 1.1780 (recent high)
TP2: 1.1820
Final TP: 1.1880 1.1890 (marked target point / liquidity above highs)
RiskReward: ~1:3+
Confirmation Triggers (Important)
Only take the trade if you see:
Bullish engulfing or strong rejection wick from the zone
Lower-timeframe CHoCH
Failure to accept below the OTE zone
Momentum