EURUSD Next Buying Move Analysis
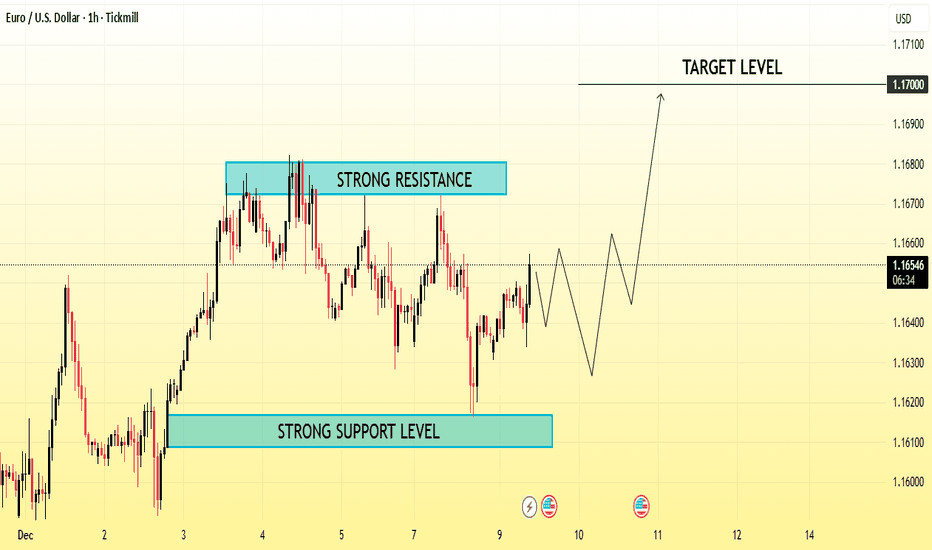
The chart is showing EUR/USD with two key zones marked
Strong Support Level (bottom blue zone):
Price has bounced from this area multiple times, meaning buyers tend to enter here.
Strong Resistance Level (upper blue zone):
Price has been rejected here several times, meaning sellers tend to enter here.
What the drawn idea on the chart indicates
The sketch on the chart suggests a bullish scenario:
1. Price pulls back slightly
2. Forms a higher low
3. Breaks above the resistance zone
4. Continues up toward the Target Level (around 1.17)
This is a typical support consolidation breakout continuation idea.
Reminder
This is only a technical analysis illustration, not a prediction or trading recommendation. Real market conditions can behave differently.